Thursday, December 12, 2013

Change over time visualisations


Image above: The Pinnacles in Western Australia. 


Where am I??  
Adelaide, Australia: S: 34º 55' E: 138º 36'


A visualisation of change over time

The change concept of the Australian Curriculum: Geography can be brilliantly demonstrated by visualisation videos and Infographics showing change over time. Here are just  a few.

* Visualisation of US expansion in North America from 1700 to 1900, seen through changes in the spatial distribution of post offices. The data from the USPS Postmaster Finder, with lat/long coordinates extracted from placenames through correlation with the USGS Geographic Names Information System.There is also an interactive version of this map.  More can be found at blog.dwtkns.com/2011/posted/ 


Many twitter users reply to their friends' tweets. When both the original tweet and the reply include location data, we can show the connections. The result is a depiction of the replies spanning the globe during one day. 

* Watch the world get older

The graph shows how, over the course of a century, Japan shifts from a nation where
children predominate to a nation of senior citizens.


A very interesting infographic using words to show change of focus with Presidential speeches.

Global Climate Change visualisation

A video data visualisation showing the change in temperature across the world over the last 200+ years. It is based on the data released by the UK's Met Office in Dec 2009.


Thursday, November 28, 2013

Spaced out! Variance across space


The uniqueness of places - Variance across space

An importance aspect of spatial literacy is an understanding of the variance across space and between places of all aspects of the physical and human world. No two places are the same and whenever geographers create a map they are inquisitive about how the aspect mapped varies from places to place across space. Whether talking about soils, vegetation, religion or attitudes, it is the thing that makes every location of the earth unique. In fact, geographers go further than just map and discuss variance across space, they are curious about the reasons for the variance. Why is this place different to all other places - the "why is it so?" question. 
The following collection of maps provide some great starting points for describing and explaining variance across space - from aspects as diverse as language, gay marriage, gun crime, happiness to hate. Whilst looking at these maps of variance it is worth harking back to the previous Spatialworlds posting on distributions and patterns.  These maps certainly show some fascinating distributions and patterns, very difficult to explain without some research or local knowledge.
Many of the examples below are US based.  it seems that the Americans are way ahead in this area of creating maps and visualisations using data of many forms to create  a representation to inform perceptions and discussion on a wide range of often quirky topics.


To interpret variance we also need to consider projections and scale.  Here are just two interesting links on these two aspects of visualisation and representation.


Sunday, November 24, 2013

David Lambert 'nails' the thinking on geography


Image above: Professor David Lambert presenting at AGTA 2013 in Perth.  The 'essence of geography' according to David - Inspiration with a message. 


Where am I??  
Adelaide, Australia: S: 34º 55' E: 138º 36'


"Without geography, the world would be a mystery to us. Geography is the subject that contributes more than any other to young people’s knowledge of the world." 
Professor David Lambert 

At AGTA 2013 in Perth in January this year I had the pleasure of introducing Professor David Lambert to the conference. David soon won the hearts and minds of the delegates by his inspiring and thought provoking address (click here to view David Powerpoint from his presentation).  As a result I thought it opportune to put this posting together highlighting the fantastic work of David in promoting geography in the UK and beyond. We were indeed lucky to have him travel down here to share his passion and thinking on geography this year.

David Lambert is the former Chief Executive of the Geographical Association and presently  the Professor of Geography at the Institute of Education, University of London. The focus of his work is very much in the areas of pedagogy, assessment and citizenship in school geography.  As the CEO of the Geography Association (GA) of the UK, he was the main architect of the Geography Manifesto: A Different View which set out the mission for geography into the future in the UK. The Manifesto made a compelling case for geography's place in the curriculum. A Different View, and the supporting materials on the GA website, are designed to be used in any context where geography is taught, explained, encouraged or promoted. The Different View video is certainly worth a look, as is David's Right here, Right Now video on geography.


The following are some writings and videos from David which give a real insight into his thinking about geography, and much much more when talking about education!

* Telegraph article


“Teachers should seize this chance to get stuck into the knowledge question rather than collectively avoid it, which has in some ways been the story of recent times. The professional language invented over the past 10 years is the language of pedagogy. 
This is no bad thing in itself, of course, but pedagogy has become so dominant that it is now confused with its apparently weaker cousin: curriculum. But it is the curriculum that teachers need to engage with.”

* Video of David on geography

“A person growing up in the 21st century as a global citizen (and all that implies) is at a disadvantage without geographical knowledge – economically, culturally and politically. How can we make any of the personal decisions that already confront us every day about energy, food and water security without geographical knowledge?
Understanding geographical perspectives contributes to our capabilities as educated individuals and members of society.”

* David on school geography


If this posting has wet your appetite for 'Lambert think' on geography, make sure you follow David's stimulating geography blog called Impolite Geography.  Every posting provides some great food for thought with 'left field' ideas and approaches to thinking about modern geography in our schools.

Wednesday, November 20, 2013

Looking for distributions and patterns


Where am I??  
Adelaide, Australia: S: 34º 55' E: 138º 36'

Can you see a distribution and/or pattern?

In the Inquiry and Skill Strand of the Australian Curriculum: Geography there is frequent reference of the geographic skill of identifying distributions and patterns when studying visual representations of geographical data. As stated in the Year 7 Skill Stand under the Interpreting, Analysis and Concluding stage of Inquiry, students are to  be able to:

"Analyse geographical data and other information using qualitative and quantitative methods, and digital and spatial technologies as appropriate, to identify and propose explanations for spatial distributions, patterns and trends and infer relationships."

The visual representations of maps, graphs and images (remote sensed images or pictures) we use in geography provide the opportunity to identify distribution, patterns and trends. In fact, such a skill is at the core of understanding and applying the Space concept in the curriculum.  As is stated in the Organisation section of the on-line curriculum.  

"The concept of space is about the significance of location and spatial distribution, and ways people organise and manage the spaces that we live in."

Most importantly we do not just want students to describe the distributions and identify the patterns but also try to explain the 'why' of the distributions and patterns through the geographical data and representations they use.


Here are just some of the great representations available on-line. Go to my Spatial Literacy Scoop.it for a extensive curation of such maps. 

We think of slavery as a practice of the past, an image from Roman colonies or 18th-century American plantations, but the practice of enslaving human beings as property still exists. There are 29.8 million people living as slaves right now, according to a comprehensive new report issued by the Australia-based Walk Free Foundation.


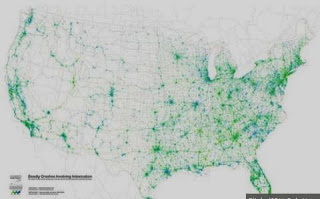
The Geography of drunk driving – patterns not easily explained by density of cars alone!


A series of maps of India helping to see patterns to birth control success.


* From the past: As mentioned previously in a Spatialworlds posting on John Snow's work, finding patterns through maps for the betterment of society is nothing new. Here is John Snow’s Cholera map from the 19th Century recreated with modern spatial technology.


* Maps to never forget 
Finally here are a whole lot of maps of things from daily fat intake, alcohol consumption, marriage rates to happiness levels. The maps are a great resource for students to identify and hopefully explain distributions and patterns through maps. Here are just a few


There are so many more maps of this ilk on-line for use in the classroom. Such maps are often referred to as Map Porn because of their quirky and seemingly useless nature beyond stimulation (however every map is likely to be useful to someone!). One thing is for sure, they are growing rapidly in number and are potentially a great resource for the classroom to engage students in mapping, to learn about aspects of their world not often studied and to develop the skills of identifying and explaining distributions and patterns.

Tuesday, November 12, 2013

Thinking about thinking geographically


Continuing to think about geographical thinking

During this year during workshops on the Australian Curriculum: Geography I have spent considerable time helping teachers to define geography and the nature of geographical thinking in the classroom. This has involved using the 7 concepts of the curriculum to help articulate ‘what makes geography geography?’ Recently I came across an excellent article from the National Geographic people that cited the following aspects of looking at something which make it a geographical look. The aspects are:

* Interaction: systems interacting
* Connexion : people with place and between each other
* Implication: how we interact with the world and make decisions
The article says that such a look helps develop the geography literacy of students. That is, develop ‘their ability to use geographic understanding and geographic reasoning to make far reaching decisions.’

Although not the Australian Curriculum: Geography key concepts, there is an obvious synergy between these three aspects and what is being promoted as geographical thinking in the Australian Curriculum: Geography. Go to the Australian Curriculum portal for details on the 7 concepts.

Needless to say that the 7 key concepts of the curriculum; Place, Space, Environment, Change, Interconnection, Sustainability and Scale are proving extremely useful in supporting teachers to think geographically.


 Concept Wheel: Copyright Malcolm McInerney 2012

Using the Concept Wheel above, the workshops have been a fun away to work with teachers in deconstructing and distilling what geographical thinking (and geography) is all about. 

What stimulated this posting is that I recently came across the poster shown at the beginning of this post. It was a really interesting take on visually showing what geography involves and certainly provides plenty of ideas and angles to discuss about geographical thinking. I will certainly use it to help teachers to make sense of geographical thinking in the future.

Thursday, October 31, 2013

A clock with a difference


Image above: The Poodwaddle clock interface.


Poodwaddle is an excellent resource to highlight the dynamic nature of statistics (and to question the origin of and veracity of data). There are many such population clocks available on the Internet but this clock does a little more than most. It breaks much of the data into regions and various categories and shows more than just population. The clock also counts mortality, crime, illness, environment, energy, food, economics and even happy things like 'first kisses' in real time. The site also hosts a life expectancy test to personalise the data. Obviously questions arise on the reliability of the data but the clock provides a great entry or teaching point on demography and diversity around the world.


Tuesday, October 29, 2013

Ecocide and human rights


An interesting angle on human rights and the environment

Last week I worked with my Year 12 Society and Culture students on presenting an oral as an advocate for human rights. Matthew, one of my students developed a paper  that argued that the ultimate human right is the protection of the environment. Only a night or two before I had watched David Suzuki on Q&A argue a similar line when he said:

"I believe what's going on now is criminal, our activity, because it's a crime against future generations," Suzuki said. "And there ought to be a legal position of inter-generational crime. And I think there's criminal negligence."

Here is the transcript of the oral Matthew presented to the class with great passion and thought. An interesting and I would say important angle when we talk about human rights, particularly in a geography class!


Human Rights: more than just sweatshops!

The right to life is our most important right of all. Without it, all others rights do not exist.
Article 3 of The Universal declaration of Human Rights states: 

‘Everyone has the right to life, liberty and security of person.’


This is a right that all human beings are entitled to.

Of course, with all rights come responsibilities. However, we as humans have neglected our responsibility of ensuring that this right to life is passed on to future generations.      
Now this may sound a tad extreme, but we are destroying the future of future generations and our most important asset of all, the environment. 

When many people think of the health of the environment, they think of it as merely the well-being of plants and trees.  But they fail to realise that it is also a critical human rights issues and that our quality of lives are deeply affected by it.

According to a report conducted by the United Nations International Panel on Climate Change, human activity has caused at least half of climate change in the last half century.
The report has also stated that the world is getting hotter, sea levels are rising and there are natural disasters occurring more frequently causing unnecessary deaths of many around the world.  So when we harm the environment, we in turn, also harm humans. The health of the Earth affects the health of the human race. 

Article 23 of Universal Declaration of Human Rights states;

‘Everyone has the right to a standard of living adequate for the health and well-being of himself and of his family’. 

But if we continue to decimate the environment, people in the future will not have this fundamental right. 

Today I would like to introduce a newly created term with you all, EcocideEcocide is the biggest threat to the human race on this planet. But what is Ecocide you may ask?

Ecocide is the extensive damage to, destruction of or loss of ecosystem(s) of a given territory, whether by human agency or by other causes, to such an extent that peaceful enjoyment by the inhabitants of that territory has been or will be severely diminished.
The most disturbing aspect of Ecocide is that it can be irreversible when an ecosystem suffers beyond self-healing.

It’s also important to note when speaking about ecocide, that is a problem facing the entire world. Ecocide is happening right now as we speak. Around the world, businesses are destroying our environment, doing everything they can to make a profit. 

Deforestation, which is the removal of forest that is then converted to a non-Forrest area, oil spills, toxic dumping, deep water mining are all of examples of Ecocide that are occurring around the globe. These procedures are not only harming the environment, but also our quality of life. Throughout history there have been conflicts over the control of natural resources such as diamonds, coal and oil which have seen the destruction of the environment and loss of many lives. 

If our most basic resources become more scarce around the world, then it would seem likely that just in just a few generations time, countries could be waging wars over our most basic needs such as food and water. 


So that’s why I am advocating for the implementation for a law that makes the destruction of our environment a crime, and for the crime of ecocide to be added to the list of international crimes against peace. Now that might seem like a fairly ambitious goal, but I believe, if enough people can get the United Nations to take notice of this issue, and make ecocide an official crime, we can eradicate ecocide.

If Ecocide is eradicated, business and governments around the world, who are committing ecocide, will use environmentally friendly means to conduct their business.
If Ecocide is eradicated, the world will become a cleaner and safer place to live.
If ecocide is eradicated, people will live longer and healthier lives. 

But we can only achieve this if each and every one of us takes on board the responsibility on preserving the environment. If it’s something small like putting recyclable material in the recycling, or taking public transport to work one a week instead of driving to work and polluting the air, we can all play a role in preserving the health the of OUR ENVIRONMENT.     

By doing this, we will ensure that next generation will be able to have the great quality of life that we have today, and so will the generations to come.


Thanks Matthew for making us 'think out of the box".

Thursday, October 24, 2013

New free on-line resources from South Australia


Certainly worth a look! 

Over recent months I have been working with DECD on their "Making the Australian Curriculum work for us' resource to support the teaching and learning of the Australian Curriculum: Geography. The resources comes out of the 'Teaching for Effective Learning' initiative of DECD.  Lyn Jefferies (DECD Manager Pedagogy R-7) is involved in developing the materials and is doing some great work in ensuring the resource is useful to teachers and students . Lyn has recently posted on the DECD site the bits and pieces referenced in this blog posting. They are certainly worth a look! 

As you can see below the resource to date includes a creative animation, broadsheets on the curriculum and 'talking heads'. I understand there will be plenty more useful things to come.  It is great to see a jurisdiction doing such high quality and innovative work to support the implementation of geography in South Australian schools and inevitably beyond.

The Story of the learning areas animation. An excellent animation on 'What is Geography for'


Talking head on geography (sorry for the head!!)   


The geography curriculum, year by year, all on one page in the Learning Area Explorer.


Sound bites from the public on their perception of geography.


I encourage you, wherever you may be, to use these resources in any awareness work you are doing with your colleagues on the Australian Curriculum: Geography (or just on geography!). 


Tuesday, October 22, 2013

AGTA's Thinking Geographically resource


Image above: Teaching resources on the Australian Geography Teachers Association (AGTA) website

manning@chariot.net.au  


The new AGTA 'Thinking Geographically' resource


AGTA has recently released for sale a resource produced to support professional learning in geography. The resource is called 'Thinking Geographically' and focuses on the teaching of the  Australian Curriculum: Geography.

The 'Thinking Geographically' resource is in the form of an interactive DVD and is aimed at preparing geographers and non-geographers in Australian schools to deliver the new Australian Curriculum: Geography from 2013 and beyond. Despite the Australian focus, the resource would be of equal value to any country teaching geography as a subject in schools.
The resource highlights the need to clearly articulate what geographer involves, to be able to explain what makes geography geography. The development of the key concepts of the Australian Curriculum: Geography has been invaluable in articulating geographical thinkingSome say that everything can be studied geographically through the key concepts - hence every topic is a potential resource for geography classrooms.

The resource comprises a range of Geographical 'think pieces', articles and presentations, tips and structures for curriculum planning and hundreds of Internet sites to support geographical education in schools. The attached document provides a useful insight into the operation and nature of the resource.

AGTA considers that the resource will be a useful part of the implementation and associated professional learning for the Australian Curriculum: Geography and any other country teaching geography in schools.

If you wish to purchase a copy of the interactive 'Thinking Geographically' DVD go to the AGTA site to download the order form or pay by PayPal via the site 

AGTA hopes that the resource will hit the mark with professional learning on thinking geographically.