Wednesday, December 3, 2008

Nothing is new, just better!


Spatial Worlds Website

Picture descriptions:
Left image: The map by Dr John Snow of cholera victims in London in 1855 .
Right image: Napoleons march on Moscow by Charles Minard in 1861.

Adelaide, Australia: S: 34º 55' E: 138º 36'

As geographers we have been using many of the GIS techniques/approaches since the beginning of the discipline of geography. Visual representations of place, space and events is nothing new and has been presented in map and chart form for centuries. What spatial technology has enabled is the ability of the geographer to crunch an enormous about of data, use overlay techniques and generally developed intricacies of digital presentations not imagined possible. That is not to say that the great cartographers and geographers of the past did not produce wonderful visualisations of data and space. When teaching students about thematic mapping and other forms of spatial visualisations it is worth showing and discussing the work of Charles Minard and the spatial mapping and analysis of Dr John Snow.
Dr John Snow is well known to many of us for his plotting of cholera cases in Soho, London in the 1840's and 1850’s. Snow developed spot maps from these outbreaks and using basic GIS applications of buffering and proximity determined that the cases were most likely associated with a particular water pump in Broadstreet (now Broadwick Street). The water pump was shut down and the cholera cases diminished. Up until that discovery cholera was thought to be transmitted by bad air or pollution. Despite the spatial analysis of Snow the skeptics re-opened the water pump after the cholera epidemic subsided. Such a simple technique of map making by hand had such power of analysis and implication for society. Imagine what Snow could have done with GIS overlays and hotspot/3D visualizations to prove his theory? Interestingly, a recent historical forensic study on the likely location of Jack the Ripper in London was undertaken by a so called geographical profiler. The profiler created simple GIS maps of attacks in London during the time of Jack the Ripper and made some basic conclusions using techniques of buffering and intersection of where the Ripper may have lived. Just imagine if we had a show on television about forensic geographical profiler involving sexy, charismatic characters like CSI? Spatial technology and geography classes would be overflowing! Maybe!
Issues of nothing new with GIS techniques came into even greater focus for me recently when I read an article about Charles Minard. Minard is best known for his amazing 1861 map of Napoleon’s March on Moscow. Many claim this is the best graphic ever produced! The map is a visualisation of troop numbers as Napoleon marched on and then withdrew from Moscow. The army was originally 422 000 in number and is represented by the width of a broad line overlaid on a map of Russia. As Napoleons army diminished to only 10 000 on his armies return to Paris, the line dwindles to being very thin. Running parallel to the troop line is a temperature graph which shows the relationship between diminishing troops and declining temperatures. The map was presented as a large format fold-out book of exquisite details and colour tones. Minard also did a similar graphics of Hannibal’s army in Italy, the movement of travelers on the principal railroads in Europe, international distribution of French wines, cotton and coal. He was indeed the pioneer of the thematic cartographer and associated statistical graphics. Many of Minard’s maps were used for planning in an era of rapid growth in Europe. For example, his map of population distribution in Paris was used to determine the location of a new central post office. Naturally such visualisations of data resulted in the sacrifice of actual locational scale. Minard “forced the scales of the geographic features on his map to fit the data being portrayed”. With the power of 21st Century GIS Minard could have overcome this conflict of priorities in his visual representations. As the article on Minard shows he also was the father of other data representations such as pie and rose diagrams. His pie diagrams were not only showing percentages of representation (type of meat for example) but also the volume of meat produced in each district as proportional pies.
Minards’ output of beautiful hand drawn and coloured maps was prodigious and included an enormous range of topics. Of special interest are his maps showing the impact of the American Civil War on French trade, patterns of European immigration around the world in the 1860’s and the movement of ancient languages throughout Europe.
Considering the elaborate and intricate maps of Minard, could you imagine his output from the click of a GIS mouse. His story is truly inspiring and relevant for the teacher of GIS in schools and the tale it tells is that many of the visualisations and techniques GIS operatives use today are not new. What is new is the capacity we have to go beyond the dreams of people such as Minard and Snow with the intricacy, commensurateness of scale and data, visual impact and the complexity of overlay of our maps.
Also of great interest is the map work and spatial analysis of Florence Nightingale. After witnessing terrible sanitary conditions in the Crimea, in 1858 she wrote "Notes on Matters Affecting the Health, Efficiency and Hospital Administration of the British Army." This document became annimportant text and included a range of maps based graphs she called "Coxcombs"(rose maps).
Such an historical approach to introducing and/or elaborating the applications of GIS in the classroom is well worth the consideration.

PS: Recently JohnSnow's cholera map of London has been recreated using GIS. What would John Snow's famous cholera map look like on a modern map of London, using modern mapping tools? With the help of mapping tool CartoDB and using the Stamen style maps, this is how it looks with larger circles representing more deaths.

Friday, November 14, 2008

Towards a National Geography Curriculum


Spatial Worlds Website

Picture descriptions:
Left image: Cold wasteland between northern Italy and Prague.
Right image: Cityscape over Nuremberg, Germany.

Adelaide, Australia: S: 34º 55' E: 138º 36'

It seems that the drive to have National Curriculum in Australia has finally got some steam up. Everywhere you go in the educational scene people are talking about the national curriculum and its impact on present state curricula. We all know it has been done and/or attempted in countries such as the US and UK for example but Australia has been a hard one to crack for the educational federalists. Previous efforts in the 80's and 90's in Australia resulted in watered down and in many cases toothless tigers in terms of a meaningful and implemented national curriculum. This push seems a little different with many saying that the teeth in this 'putsch' for a national curriculum is the federal governments determination to link assessment and funding to implementation. Proof of this determination can be seen in the recently passed Australian Curriculum and Assessment Authority legislation which is being established in 2009.
So what!! What does this mean to geographical education and by association, spatial education. Pleasingly for Australian geographers, the Australian Government via the National Curriculum Board has identified geography as the discipline to be developed and implemented across Australia as part of the second phase of national curriculum implementation in 2011(history, science, math and english in the first phase). In the case of history the materials developed to date are strongly tied into pre-existing australian government documents such as the 'Civics and Citizenship Statements of Learning' and the 'Model for Australian History'. When geographers in Australia looked around for similar national geography curriculum documents as reference points for the National Curriculum Board to use when they commence their work on geography, it soon became apparent that no such documents existed. To remedy this situation and provide guidance to the national curriculum board in 2009, the Australian Geography Teachers' Association, the Institute of Australian Geographers and the Royal Geographical Society of Queensland have established in October 2008 an initiative called 'Towards a National Geography Curriculum'. In short, the aim of the project is to develop a document, after extensive consultation with geographers around Australia, which will provide guidance for the National Curriculum Board when it commences its work on geography in 2010. It is hoped that such consultation and synthesis within the geography community by the geography community will ensure that a truly representative and quality curriculum is developed by the National Curriculum Board. As is stated on the Towards a National Geography Curriculum website:
"We are preparing a paper titled Towards a National Geography Curriculum for Australia modelled on the National Curriculum Board’s proposed structures for the national curriculum for subjects in the first phase of its work. These will set out “the nature of knowledge involved, the ways in which knowledge is acquired and tested, a rationale for the choice of content …, and the broad scope and sequence of learning”."

This is an exciting time for geography in Australia and a once in a lifetime opportunity for the meaningful integration of technology into geographical education. If we are to develop a geography curriculum for students which reflects the needs of the 21st century, then it is imperative that we consider the amazing and enabling technologies which are available to geographers and the community worldwide on a daily basis. Such technologies should be our tools in schools to make sure that our subject has currency and is the social, economic and citzenship enabler it should be for young people. Keep posted on this one, hopefully it will provide a way forward for innovative and current geographical education in our schools. In the meantime put your views forward via the Towards a National Geography Curriculum on-line survey.

Thursday, October 16, 2008

AGTA 2008 Conference gems


Spatial Worlds Website

Picture descriptions:
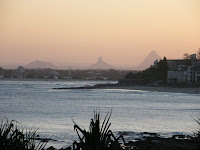
Left image: Glasshouse Mountains from Caloundra.
Right image: Brisbane from the air.

Caloundra: S:26º 81' E:153º 12'

AGTA 2008 Conference in Queensland
As always conferences are a great time to get new ideas and have the time to look at some new websites. The AGTA Conference on the Sunshine Coast from September 28th to October 2nd was no exception. In this blog entry I will describe six things that I found of interest and immediate use.

1. A reducing world: using technology to bring the world into your classroom by using the iEARN and Take it Global website.

iEARN (International Education and Resource Network) at http://www.iearn.org/
iEARN is the world's largest non-profit global network that enables teachers and youth to use the Internet and other technologies to collaborate on projects that enhance learning and make a difference in the world.

Some useful sections of the site:

Carbon footprint http://of2.iearn.org/
Our Footprints, Our Future!" is an international initiative that encourages youth (ages 19 and younger) from around the world to use online tools and resources to measure their carbon footprint and develop ways to reduce their carbon usage. The goal is for one million students around the world to join together with their families, their schools, and their communities to reduce the total global carbon footprint.

Register now for Oct 13 - Dec 15, 2008 session of iEARN Online Professional Development Courses for educators. iEARN's 9-week courses bring together participants from around the world to develop plans and techniques for integrating global projects into the classroom. http://www.iearn.org/professional/online.html

Taking it global at
http://www.takingitglobal.org/tiged/
TakingITGlobal.org is an online community that connects youth to find inspiration, access information, get involved, and take action in their local and global communities. It's the world's most popular online community for young people interested in making a difference, with hundreds of thousands of unique visitors each month. TIG's highly interactive website provides a platform for expression, connection to opportunities, and support for action. Join now and connect with thousands of other young people around the world.

Media literacy booklet http://www.takingitglobal.org/tiged/
As media becomes more digital, everyone needs to learn how to get the most out of what they read, watch and listen to. TIGed's new Digital Media Literacy Primer is a great way for teachers to bring important information into their classrooms. With explanations of great online tools and suggestions on how to teach with them

Understanding issues section at http://www.takingitglobal.org/understand/
This section of TakingITGlobal helps you inform yourself about pressing global issues, and lets you explore TIG's Featured Theme archive

Games and fun at http://www.takingitglobal.org/games/
The flag game at http://www.takingitglobal.org/games/flag/ is worth a look for Geography classes.

2. The Cluster search engine at http://clusty.com/
If you are sick of searches on the Internet where you get pages and pages of unsorted finds. The Clusty search engine is your answer! Clusty sorts your search into clusters or categories. For example if you type in GIS you get the option on the left side of the results to view the jobs in GIS, countries and GIS, free GIS options, GIS portals, GIS history and many more categories. What a great facility to isolate your search requirements. If that doesn’t make sense just do the search and it will show you the potential of this engine for your searches.

3. The Picasa web image library at http://picasa.google. com/
This program can be downloaded free and is a great way to store your images on the web. Picasa enables you to organise your photos and store them in one place, edit your photos, create movies/collages/slideshows etc and to share the photos via web albums.
To compliment the Picasa program open up a Google account (if you have not already) and start using a Picasa web album http://picasaweb.google.com/home . The use of the Picasa web library is an imperative if you intend to upload images into Google Earth or Google maps. These programs only load images from the web and not from your hard drive.

4. Google SketchUp at http://sketchup.google.com/index.html is a great program to create 3D objects such as buildings and landscape objects. What is really amazing is that these 3D objects can then be imported into Google Earth as buildings etc. The program is easy to use, has excellent instructions for use and is an ideal educational tool to add 3D dimensions to mapping projects. The K-12 Education page is of particular use to the geography teacher interested in SketchUp.

5. Eduspace at http://www.eduspace.esa.int/eduspace/main.asp?ulang=en has some great images and educational materials. As usual well worth the look.
The EduSpace-site aims to give to the youth of Europe a portal to space applications and in particular to a wide-spread visibility of Earth Observation as co-ordinated by the European Space Agency (ESA) and its European and National Partners.

6. 3D in Google Earth at http://earth.google.com/
We have all played with Google Earth by now but I was surprised by the new 3D capability as evidenced at Uluru. A real addition is the ability to map a path and fly around in Google Earth via the flight simulator. While talking about virtual flight, check out the Microsoft Flight Simulator at http://www.microsoft.com/games/FlightSimulatorX/ This site is a flight game with realistic terrain, scenery and weather to deal with.

These are just a few of the gems I brought back from the conference and now need to learn how to use and apply to the classroom for teachers. If you want to view the conference presentations go to the AGTA site at http://www.agta.asn.au/conf08/presentations.htm
Well done to Bec Nicholas and David Lergessner for a great conference.

Tuesday, September 16, 2008

Spatial technology: omnipresent goodness versus insidious invasiveness


Image description: The Clustrmaps image of the world showing the hits on the Spatialworlds blog from 27/9/07 - 19/9/08.


Spatial Worlds Website

Adelaide, Australia: S: 34º 55' E: 138º 36'

The pervasive technology
Many people talk about the pervasive nature of spatial technology. Even my blog uses spatial technology in the form of the cluster map which appears as the first blog entry. Cluster maps are basic dot maps which plot and quantify the hits on my blog. How amazing that the technology can record, plot, quantify and visually represent every person in the world who access my site. Cluster maps are free to add to websites and blogs and can be accessed via the cluster map site at http://www.clustrmaps.com/.
While I have only had 602 hits over the past 12 months (apparently not showing all the hits), what is really interesting to me are the places the blog has been accessed and having a relative idea of the places where the blog is most popular.
In summary, the locations which have used the blog the most are Hong Kong, Dallas, Melbourne, Washington, Sydney and Toronto. The blog has been accessed from 26 world locations, with the majority of hits being in the US and Australia. All interesting stuff but also something to contemplate. Whilst pervasive means omnipresent and everywhere, it also means insidious and invasive. I can't help thinking that there is something 'big brother' about knowing the location of all those in the world who access my blog. Such a capability of spatial technology is only the tip of the iceberg to the monitoring ability of spatial technology. For example, GPS technology is being used for parental monitoring of their children , avoiding domestic violence stalking and monitoring prisoners on home release. I am confident the majority of spatial technology is used for the common good of society but it is also a technology which can be put to ill-use in society. More recently the media outcry over the invasive nature of Google Maps Streetview highights the potential this technology has to be abused by those wanting to invade privacy and profit by invasive monitoring of individuals. While the nature of Streetview is obvious to the majority of the public due to its wide use, there are many more spatial technologies which impacts on our daily lifes and we don't even know it. For example how does the taxi company know where we are when we ring up and why do we get text messages when we are in some particular location? All spatial technologies!! Several great Youtube videos demonstrate through humour the fear in society of the invasive nature of spatial technology

For many citizens the publicity about Google Maps Streetview has just confirmed their fear of the insidious nature of technologies such as GIS and GPS. Much of this fear is out of ignorance and fear of the new. However we do need to make sure that the technology does remain philosophically sound for the common good of society. I am sure those in the Dark Ages had a similar fear of books! It is beholden on education systems to reduce the ignorance and fear of spatial technology. Only then can society be empowered to understand and even monitor this powerful technological monitoring tool. Maybe wishful thinking but worth a try.

Saturday, September 13, 2008

Spaced out over time: Historical GIS


Spatial Worlds website

Picture descriptions:
Left image: Tower of London Bridge, London.
Right image: A ruined keep in Eire.

Adelaide, Australia: S: 34º 55' E: 138º 36'

Space+place+time = Historical GIS

If you can read it, why not map it!!


It can be said that history is determined by space and place over time. If so, then why not involve history students in mapping using spatial technologies? The wonderful technology of GIS now allows the amateur ICT user to use a high level technological tool to map both simple and complex spatial representations and relationships. Increasingly educators in the US are looking at the potential of GIS for the teaching of Historical events and concepts in the classroom.
Geography is the study of spatial differentiation and history the study of temporal differentiation. GIS provides the tools to combine them to study patterns of change over space and time.
GIS is becoming the meeting ground for historians, scientists, anthropologists and geographers, to name a few. Historical GIS is proving to be a valuable research method, a framework for digital archives and a means to bringing a geographical/spatial sensibility to our view of history. Historical data has the z factor of time and GIS adds the x and y factor of place.
GIS digitally links locations and their attributes (attached information) so that they can be displayed in maps and analyzed, whether by their geographical characteristics, such as location, distance, proximity, density and dispersal. GIS representation will also involve identifying the social, economic and physical characteristics of a place at a particular time in history.

GIS is a wonderful tool to enhance learning in the classroom. There are examples (all too few) of history teachers using GIS in the history classroom. In essence, we need to focus on the concept that time studies have a spatial dimension that can be highlighted by the use of GIS processes and field studies. Such a premise is nothing new and has always been at the core of the treatment of many historical topics. What is new is that we now have a resource and technological tool in the form of GIS that can bring place, space and time studies alive for the students. GIS processes such as area, point and line representation and tracing, image/feature/script hotlinking and thematic representation are perfect to trace and display historical data across space.
In the excellent book, 'Past time, past place: GIS for History' (ESRI Press 2002), Anne Knowles succinctly states that “Geography is the study of spatial differentiation and history the study of temporal differentiation. GIS provides the tools to combine them to study patterns of change over space and time”. Such an association is resulting in GIS becoming the meeting ground for historians, scientists, anthropologists and geographers, to name a few. Historical GIS is proving to be a valuable research method, a framework for digital archives and a means to bringing a geographical/spatial sensibility to our view of history. The use of GIS in space and time studies could be summarized as “historical data having the z factor of time and GIS adds the x and y factor of place.”

The literature on historical GIS suggests that the GIS processes employed by students in the classroom can involve:
* Analyzing change in space over time.
* Attaching sources/data/images to location.
* Tracking movement over space.
* Searching databases over space.

A range of simple GIS applications can be used in historical studies. These achievable historical GIS starters include:

1. The spatial arrangement of graves in a cemetery and associated hotlinked image/script data and thematic characteristics
2. Tracing of explorers routes with associated hotlinked mage and script data
3. World War 1 battle movements, data searches and hotlinked image links and data representations.
4. Map digitizing of aerial photographs to show change over time.
5. Polygon representations of a suburban block with associated created data tables showing feature thematics and hotlinked images and information.

If interested in the explorer practical which is a chapter of my book, ’Historical GIS: Space+place+time’ go to my website and download the chapter for free. Chapters on mapping change over time, building heritage, cemeteries and battles can also be downloaded from the Spatial Worlds website.

To undertake the historical GIS activities in the book, a wide range of GIS skills were employed
The skills were:
1. Adding data files to create a base map.
2. Using scanned maps to create a base map.
3. Creating Thematic maps of represented data.
4. Creating original maps with points, lines and areas on pre-existing maps.
5. Creating and customising data bases
6. Selection maps involving searching databases.
7. Hotlinking scipt, chart and image files to point, line or area themes.
8. Using GPS to plot features on a map.

I still remain excited about the use of GIS in history teaching but it continues to be a battle for history teachers to embrace the technology and commence the learning curve. Those who have are doing some great work connecting place, space and time to energise history in the classroom.

A good indicator of the lack of engagement with GIS by history educators is that the excellent 'Teaching History with Technology' website does not explore the use of GIS in history as a valid technological application. However, there are a few useful websites relating to spatial technology in history but I see that the history classroom continues to be unchartered waters for the use of spatial technology. It amazes me why a teacher studying Gallipoli would not at least use Google Earth to look at the Gallipoli Peninsula, let alone map the troop movements via GIS. For some ideas on historical mapping go to my blog entry on visiting the battlefields of Flanders.

An excellent source of aerial images on World War 2 can be found on the Scottish National Collection of Aerial Photography website. This site is a great example of the potential of spatial technology to support the teaching of history.

Wednesday, August 20, 2008

Why should we? The reasons to use GIS in the classroom


Spatial Worlds website
Picture descriptions:
Left image: The sinking city of Venice.
Right image: Factory spewing forth in Milan, Italy.

Adelaide, Australia: S: 34º 55' E: 138º 36'

Some research ideas
Increasingly people are talking about spatial literacy and the use of spatial technology in the classroom. A question often asked is, where is the research? Whilst there is a great need to expand the research on the nature of spatial literacy and the impact of spatial technology on student learning, there is literature around which has started the ‘ball rolling’ in looking at the empirical data and research in the area. This blog post list some of the current literature on the topic. Such documentation may be of use to the teacher trying to justify their pre-occupation with the area of spatial technology and literacy. While not a definitive list it may provide a start to putting together your own research paper on the topic to convince the powers to be to spend money on spatial technology in your school and to take this vital area of education seriously.

Just a few quotes to get started:

“Getting a new idea adopted, even when it has obvious advantages, is often very difficult… a common problem for many individuals and organizations is how to speed up the rate of diffusion of an innovation”
Everett Rogers, Diffusion of innovation, 1995

“GIS represents the single biggest contribution geographers have made to society and economy since the Age of Discovery”
Patrick Wiegand, School of Education, University of Leeds

“Spatial thinking is an increasingly important skill for living and working in the 21st century, the council said, and geographic information system (GIS) technology can help schools teach this skill to their students. Spatial literacy will play an increasingly important role in today's information-based economy, and it should be incorporated into K-12 instruction”
Learning to Think Spatially (www.nap.edu/ catalog/11019.html)

“Some educators consider GIS to be one of the most promising means for implementing education reform in US schools”
Dr Joseph Kerski : ‘The implementation and effectiveness of GIS Technology & methods in Secondary schools, 2001

Publications/articles/websites

* Baker Tom: The History and application of GIS in Education: http://kangis.org/learning/ed_docs/gisNed1.cfm
* Becta 2004; What the research says about ICT in geography; http://becta.org.uk/research
* Bednarz Sarah Witham, Associate Professor of Geography, Texas A&M University Learning to Think Spatially www.nap.edu/ catalog/11019.html
* Exploring common ground: The promise of GIS in education: http://www.esri.com/industries/k-12/download/docs/xcg.pdf
* Geographical Association paper 2005: GIS in Geography teaching and learning: http://www.geography.org.uk/projects/gtip/thinkpieces/gis/
* GISAS: Geographical Information Systems applications for schools 2005: http://www.agile2006.hu/papers/a317.pdf
* Goodchild, Michael: Center for Geographic Information and Analysis and Department of Geography, University of California http://www.csiss.org/SPACE/about/docs/ArcNews_Goodchild-the-4th-R.pdf
* Kerski, Dr Joseph: ‘The implementation and effectiveness of GIS Technology and methods in Secondary schools, 2001
* Kerski: Joseph: A National Assessment of GIS in American High Schools 2001
* Rogers Everett: Diffusion of innovation 1995: http://www.zonalatina.com/Zldata99.htm
* Wiegand, Patrick : School of Education, University of Leeds: Forum GIS in Education; http://www.multilingual-matters.net/irgee/010/0068/irgee0100068.pdf
* http://www.eastmidlandscetls.ac.uk/splint/
* http://edcommunity.esri.com/
* http://ednewsbytes.blogspot.com/2006/04/schools-urged-to-teach-spatial.html
* http://www.edb.gov.hk/
* http://www.ga.gov.au
* http://www.spatial-literacy.org
* http://www.scangis.org/scangis2003/papers/20.pdf
* http://www.mansfield.ohio-state.edu/~ocosta/betha.pdf
* http://www.myworldgis.org/docs/GISinEd_Workshop.pdf
* http://andorraweb.com/bass/

Tuesday, August 19, 2008

Teaching ideas galore at GTAV


Spatial Worlds website

Left image: Fast train luxury, Ice trains in Germany
Right image: Athens by air.

Melbourne, Australia: S: 37º 47' E: 144º 58'

GTAV Conference in Melbourne
As always, the Victorian Teachers Association of Victoria (GTAV) conference in Melbourne was a great event for geography teachers. The GTAV crew put together a conference on August 8th and 9th full of teaching ideas and resources for the new and experienced teacher. In this blog I am going to concentrate on the spatial technology resources presented by Rebecca Nicholas from Bacchus Marsh Grammar. Rebecca has been incredibly busy in Queensland and now in Melbourne being innovative in the classroom with the use of spatial technologies. In her spare time (what spare time?) Rebecca has also been organising the 2008 AGTA/STIS conference on the Sunshine Coast commencing on September 28th. The conference should be a wonderful opportunity for the spatially aware and technologically motivated to learn and share knowledge, methods and ideas.
At the GTAV conference Rebecca’s workshop was titled ‘Using Spatial Technology in the Geography Classroom’. Rebecca gave a stimulating and concise explanation and demonstration of the use of spatial technology, the nature of spatial literacy and the Internet resources available to use in the geography classroom.

The definition of spatial literacy Rebecca used in the workshop should be of interest to this blog:

“To be considered ‘spatially literate’, an individual must have the ability to capture and communicate knowledge in the form of a map, to understand and recognise the world as view from above, to recognise and interpret patterns, and to comprehend such basic concepts as scale, projection and spatial resolution.”
Goodchild (2006)


….and of spatial technology:

“Spatial technologies include any form of technology that refers to place, space and location. Specifically, they are technologies that organize and collect data, by referencing the information collected to a point on the earth’s surface using latitude and longitude.”
Nicholas(2008)

Rebecca’s workshop provided an excellent context for the use of spatial technology in the classroom and was very rich with ideas and sites to visit (not to mention the great Youtube videos on the latest spatial technologies). Here are just some of the sites mentioned. Thanks to Rebecca for giving me permission to include in the Spatialworlds blog her summaries of these sites in terms of spatial technology and spatial literacy.

Google Earth Resources for Geography Teachers, http://www.geographypages.co.uk/googleearth.htm
A multitude of resources for Geography teachers on how to use Google Earth in the classroom. This site was established and maintained by a UK Geography teacher.
Earth As Art, US Geological Survey, http://earthasart.gsfc.nasa.gov/index.htm
This site combines satellite imagery with art to provide fantastic images of the earth’s surface. You are able to view and download high resolution images, taken by the Landsat 7 satellite and the Terra Satellites Advanced Spaceborne Thermal Emission and Reflection (ASTER). Environmental Graffiti, an online journal, produced an article on the ’30 Most Incredible Abstract Satellite Images of the Earth’ (http://www.environmentalgraffiti.com/ecology/30-most-incredible-abstract-satellite-images-of-earth/1324/3
Globe At Night, http://www.globe.gov/GaN/
You will need to click on ‘map’ to view the data. This amazing website allows you to either view the collected data, or download it to suit your GIS software.
Global Land Cover Facility, http://glcf.umiacs.umd.edu/index.shtml
The GLCF is a centre for land cover science with a focus on research using remote sensing data. The site provides earth science data and products to help everyone better understand global environmental systems. In particular, it develops and distributes remotely sensed satellite data. All data from this site is available for free. To view and download the data, you will need to access it via the ESDI (Earth Science Data Interface), a web application for searching, browsing and downloading the data. The site also provides clear explanation of the role of different satellites and the types of data they collect. When on the site, have a look at the special collections. These include imagery from the 2008 China Quakes, Hurricane Katrina and Rita and the 2004 Tsunami.
NASA Earth Observatory, http://earthobservatory.nasa.gov
This site provides access to an enormous number of satellite images. The site provides featured images each day, as well as breaking news articles that feature satellite imagery. Current topical stories are also provided, with satellite imagery. Topics include climate change, natural disasters, deforestation, pollution etc. Three other tools are also available on this site. These
Woophy.com, http://www.woophy.com/map/index.php
This site is a global field trip waiting to be explored. It allows the user to interact with the site by choosing any city in the world, and look at photos taken at the site. You can even add your own photos to a point. The site incorporates the 'Hotlinking' aspect of GIS.
Globalis: An Interactive World Map, Grid Arendal United Nations Environment Programme, http://globalis.gvu.unu.edu/
This is an interactive world atlas with country statistics related to sustainable development. Globalis aims to create an understanding for similarities and differences in human societies, as well as how we influence the planet. A number of map layers are provided. Globalis also allows the user to display a number of thematic and statistical maps according to indicators. A written description appears beneath each map, explaining what it shows. To view this map you need Internet Explorer 6 or Firefox
OzCoasts and OzEustaries,
http://www.ozcoasts.org.au/
OzCoast and OzEstuaries provide comprehensive information about Australia’s coast, including its estuaries and coastal waterways. This information helps to generate a better understanding of coastal environments, the complex processes that occur in them, the potential environmental health issues and how to recognise and deal with these issues.
Health Map:Global Disease Alert Map, http://www.healthmap.org/en
This site uses Google maps as the viewing platform to provide spatial information on the world’s diseases. The site uses various RSS news feeds from medical data bases and news sites, including Google News and the World Health Organisation. Using this data, the site maps reported cases of diseases in the last 30 days. The viewer can zoom to specific countries and continents, as well as specific alerts by country. The site uses GIS layering of the differing disease, so these layers can be turned on or off.
Geocaching Australia, http://geocaching.com.au/
Geocaching Australia provides statistics and tools to analyse Australian and New Zealand Geocaches and Geocachers using details from several cache listing sites as well as providing a place for listing geocaches directly in any country around the world.
Degree Confluence Project, http://confluence.org/
The goal of the project is to visit each of the latitude and longitude integer degree intersections in the world, and to take pictures at each location. The pictures, and stories about the visits, will then be posted here. Viewers are invited to post any of the existing confluence. Also, have a look at the antipodes, points on opposing sides of the world.

Monday, July 7, 2008

At what cost? The Internet and GIS


Spatial Worlds website
Picture descriptions:
Left image: Central Park, New York on a lazy Sunday afternoon.
Right image: Old and new in New York Harbour.

Adelaide, Australia: S: 34º 55' E: 138º 36'
During the early days of GIS implementation in schools the argument was often forwarded that we cannot do GIS because of the cost! Yes, there was and still is a cost to purchase excellent classroom GIS software such as ESRI ArcGIS. However as the Internet has grown and evolved there is a now a plethora of data, remote sensed images and even software available free to schools. All that is required to do GIS is an Internet connection (preferably fast broadband to handle large downloads and images) In fact there is nothing stopping a teacher using GIS in their classroom if they have access to the Internet and some time to learn to use the free software and develop classroom activities around the free maps and images. This posting aims to provide some useful sites for the teacher wanting to use GIS with the minimum of expense.

MapCruzin:
An excellent spatial technology overview blog containing free GIS, map downloads, GIS/GPS tuition, GIS news, RSS feeds and much more at http://www.mapcruzin.com/

For links to free GIS software go to the previous Spatialworlds posting titled 'Webmapping: GIS on the Internet' at http://spatialworlds.blogspot.com/2008/03/webmapping-gis-on-internet.html

The earth from above! Understanding and viewing satellite images
Some great use of satellite images from the USGS at: http://glovis.usgs.gov

NASA satellite tracking in real time at: http://science.nasa.gov/realtime/

An article on the NASA's Earth Observatory site at http://earthobservatory.nasa.gov/
The article looks at the development of higher resolution satellite imagery enabling more detailed images of cities at night. Not only is this is a good article on the development of spatial technologies, but it also provides excellent images and explanations of the world's cities at night. An excellent resource for a unit on transport routes.

Some great images of Cities at Night can be found at http://earthobservatory.nasa.gov/Study/CitiesAtNight/
Subscribe to the site for updates, as most news and images are relevant to all units of Geography.

Blue Marble: Next Generation was a project by the Earth Observatory that aims to "provide a detailed look at an entire year (2004) in the life of our planet". Images were taken each month. - http://earthobservatory.nasa.gov/Newsroom/BlueMarble/

The magic of data and space

NationMaster
NationMaster is a massive central data source and a handy way to graphically compare nations. NationMaster is a vast compilation of data from such sources as the CIA World Factbook, UN, and OECD.
http://www.nationmaster.com/index.php

Geo-Data and GIS
This is the place to find data projects and GIS information. For example, weather data projects, development data as well as digital maps and ideas for the use of GIS.
http://www.sln.org.uk/geography/gis.htm
FreeGeo-data city data download at http://www.geodatasource.com/cities-free.html

National Geographic EarthPulse website
Maps on the Human condition, nature and connections. Some interesting opportunities for correlation of data http://www.nationalgeographic.com/earthpulse/index.html

Health and GIS from the UK
Investigating the health of a nation, a city, a locality. The website activities uses geographical health data to show distribution and ask questions on health in an area. http://www.sln.org.uk/geography/haz2.htm

Maps and globes
A site providing free world maps and images of the earth from space
http://www.globe-images.com/

Discussion starters using data

World rich list
Every year we gaze enviously at the lists of the richest people in world.
Wondering what it would be like to have that sort of cash. But where
would you sit on one of those lists? Here's your chance to find out.
http://www.globalrichlist.com/

Ecological footprints
http://www.footprintnetwork.org/gfn_sub.php?content=footprint_overview
http://www.royalsaskmuseum.ca/gallery/life_sciences/footprint_mx_2005.swf
http://www.bestfootforward.com/carbonlife.htm
http://www.earthday.net/footprint/
http://www.worldmapper.org/display.php?selected=322
http://www.islandwood.org/kids/impact/footprint/footprint.php
http://www.sustainability.govt.nz/

Monday, June 23, 2008

Getting together: Communication technologies and some questions!


Spatial Worlds website
Picture descriptions:
Left image: Concrete jungle: New York.
Right image: Electrical overload: Times Square, New York

Teaching Australia Network Forum
Sydney, Australia: S: 33º 53' E: 151º 10'
On June 22nd-23rd I attended the inaugural Teaching Australia Network Forum in Sydney. The forum was conducted to bring together the 35 National professional teacher associations across Australia to discuss possibilities of co-operation under the banner of Teaching Australia. Teaching Australia is a federally funded body (a public company limited by guarantee, established under the Commonwealth Corporations Act 2001) which organises and co-ordinates a range of initiatives designed to enhance the teaching profession in Australia. These initiatives include teacher awards, teaching standards, a teaching profession charter and co-operatives futures inspired activities, such as the association forum. In this blog I won’t dwell on the bulk of the workshop discussions which focused on why, how and in what form an association network could be structured by Teaching Australia. The forums catchcry “for the profession by the profession” certainly is a fine sentiment if we are to progress the quality, status, influence and reputation of the teaching profession in Australia.

The section of the forum I would like to focus on in this blog is the use of technology by students, schools and associations. Ron Hair from Affiniscape presented an excellent talk on the way technology is changing and evolving as evidenced by the ever growing use of Podcasts, Wikis ,Nings and social networking sites such as Facebook and MySpace. I found the talk a great summary of what is presently happening with communication technologies and where it is going. The focus of Ron’s talk was on how associations need to understand and embrace the changes to Web technologies if they are to service their members as functional entities.
Here are some useful thoughts, information and links from the presentation:
1. Associations need to change and use technology to personalise their relationships with members in an effort to remain relevant and useful. The Web 1.0 function of being the disseminator of information has been replaced by Web 2.0 which involves an ‘architecture of participation” in a re-write environment. Social software such as MySpace, Facebook and Wikis are central to this new participatory environment. “Now the individual controls the information age.” Web 2.0 innovations such as YouTube, blogs, Wordpress and Flickr has resulted in the democratization of news and information. “Users add value to websites and it gets better the more people use them.”
2. ‘Linkedin’ is a professional version of MySpace.
3. The way we communicate has changed drastically. The website ‘101 things about associations we must change' uses associations as an example to show the way things have changed with Web 2.0.
4. ‘Google Alerts’ are email updates of the latest relevant Google results (web, news, etc.) based on your choice of query or topic. Worth adding to websites and blogs.
5. Add an RSS feed to your website via ‘FeedBurner’. FeedBurner is the leading provider of media distribution and audience engagement services for blogs and RSS feeds. Check out the ‘In plain English’ YouTube video to find out about RSS. While there check out the other ‘In plain English’ YouTube feeds. Very useful to get an understanding of new technologies.
6. Google offers the ability to create a personalised iGoogle page that gives an at-a-glance access to key information from Google and across the web.
7. ‘Google analytics' is designed to help learn even more about where website visitors come from and how they interact with your site.
8. Build the ability to survey from websites via ‘SurveyMonkey’.
9. ‘WordPress' is a state-of-the-art publishing platform with a focus on aesthetics, web standards and usability.

The meeting was a great opportunity to formally and informally network with a group of dedicated and articulate teaching professionals. I now have plenty of work to do to transmit the work of Teaching Australia to members of AGTA. Maybe setting up a Web 2.0 environment for AGTA and the GTASA could help this communication for our associations in the future.

Some questions related to spatial literacy and communication technologies.
What are the spatial implications of the technologies discussed on this blog? What is the impact on individuals and communities? Do these technologies change the spatial perception of the world? Due to such comminication technologies and our immediate accesss to all parts of the globe via the Web has there been a shift in how we perceive space? Distance has almost become secondary to our considerations when thinking about the space called earth. Unless travelling physically, anywhere or anyone in the world is only a click away. In the long term what will be the effect of this on the spatial perception abilities and literacies of humans? Are modern technologies actually making us spatially illiterate? Do we rely on Google Maps to get somewhere instead of reading a map or trusting our navigational instincts? Do we use Google Earth to see a location virtually instead of actually going there? Is the use of spatial and communication technology making the world a smaller and better place for the future? More on these questions in another blog when I find some research on the impact of modern communication technologies on spatial literacy.

Did you know? The National Geographic Channel Australian Geography Competition


Spatial Worlds website
Sydney, Australia: S: 33º 53' E: 151º 10'
Picture descriptions:
Left image: Students on stage at the National Geographic Channel Australian Geography Competition U16 final in Sydney.
Right image: The groynes for sand retention along Botany Bay in Sydney.

Last week I had the pleasure to be involved in the National Geographic Channel Australian Geography Competition U16 final in Sydney. The competition has been conducted since 1995 by the Royal Geographical Society of Queensland (RGSQ) in cahoots with the Australian Geography Teachers Association (AGTA). The competition is a great vehicle to promote geography in schools and to explore the depths of the geographical knowledge and spatial understanding of students. In fact, in 2008 over 90,000 students across Australia entered the competition. To enter, schools simply have to nominate the number of students participating and then conduct a 35 minute test on site. For competition information go to http://www.rgsq.gil.com.au/agc.htm . The number of students involved has steadily grown over the years and the competition has rapidly become an important component of AGTA’s desire to promote geography in schools. The competition final for the U16 category of the competition was conducted at the Taronga Zoo auditorium on June 16th. The quiz mistress? for the final was Jacinta Tynan from Sky News Australia who put the students through a rigorous session of questions related to geography. It is worth going to the Royal Geographical Society of Queensland’s website at http://www.rgsq.gil.com.au/questioc.htm to get an idea of the questions the students are asked in the competition. The ability and knowledge of the students was amazing during the final and certainly put this geographer to shame! Questions like; what countries does the Prime Meridian pass through and the 6 largest land area continents were answered at lightening pace by the students on stage in front of over 200 of their peers and adults. Quite an intimidating experience which they mastered very well. The eventual winner after a tie breaker of three questions was Miguel Vera-Cruz from Fort Street High School in Sydney. Miguel defeated David Giles from Pembroke School in South Australia who did a great job (not being biased!).
As the Acting Chair of AGTA, I appreciated the opportunity to MC the event and to see first hand how professionally the competition is conducted by Kath Berg (RGSQ) and Margaret McIvor (AGTA) from Queensland. I am sure the competition will continue to promote geography in Australian schools as it continues to grow.
To learn more about the competition go to http://www.rgsq.gil.com.au/agcoverc.htm

To get a head start on the competition, the following geographical knowledge/quiz orientated spatial sites may be of use to your students preparing for the competition (or just for your interest).
http://www.mywonderfulworld.org/global_iq.html
http://www.sheppardsoftware.com/Geography.htm
http://kids.nationalgeographic.com/Games/GeographyGames/Geospy
http://www.infoplease.com/ipa/A0001769.html

Please consider being involved or extending your participation in the competition. All students get participation or a credit/distinction/high distinction certificate. Competitions such as this are a great pretext to award the certificates at a school assembly. Such promotion is important to reinforce that geography is an integral, dynamic, exciting and important component of the school curriculum. To help geography grow and respond to the opportunities the National Curriculum has provided geography, we must become marketers and promoters of our subject at the school, local and National level. The National Geographic Channel Australian Geography Competition provides this opportunity!

Thursday, June 12, 2008

Being a citizen: mapping politics


Spatial Worlds website
Canberra, Australia: S: 35º 15' E: 149º 08'
Picture descriptions:
Left image: Civics and Citizenship Teacher Forum in the South Australian Parliament House on May 28, 2008.
Right image: Nursery Swamp in the Namadgi National Park(40 kms south of Canberra). This swamp is the largest sedge peat deposit in the Australian Capital Territory and is a valley fill fen.

Spatial Technology and Civics and Citizenship
Although not normally seen as directly related to spatial technology, I thought it worth reporting on the Values Education and Civics and Citizenship forum that I recently attended in Canberra. Having said that, I do feel that spatial technology has a lot to offer in the area of civics and citizenship and the whole area of schools educating citizens for the 21st Century. Needless to say, for a citizen to live and indeed survive in the society of today they need to be at least aware of the power of spatial technology. GIS in particular is used increasingly by governments for planning and also for the monitoring of citizens. A citizen able to use spatial technology is empowered to be an active and informed participate in all aspect of civilian life. Linking into the aspects of citizenship is the nature and role of values in everyday life. Increasingly governments are seeing schools as the place to instil values and prepare citizens for our society (http://www.civicsandcitizenship.edu.au/cce/about_civics_and_citizenship_education,9625.html). As political and contentious as this may be, it is important that we enable students to be active participants in society. Here is a brief summary of some relevant learning related to spatial technology from the conferences:

Values Education and Civics and Citizenship Conferences in Canberra from May 29th-30th and June 2nd-3rd, 2008, organised by the Australian Government Values Education program and Civics and Citizenship Assessment program. The conferences are on-going events conducted to support the implementation of Values Education and Civics and Citizenship in Australian States.

Relevant links from the conference
1. Professor Marty Seligman’s from the University of Pennsylvania presentation on positive education was excellent. His presentation gave a framework for a positive approach to curriculum as opposed to deficit models of approach i.e. what are the problems with the environment as a starting point for environmental education. GIS has a role to support this positive approach to such issues by focussing on monitoring and planning for the future instead of just focussing on the problems without strategies to address the issues. It is worth visiting Marty's site at http://www.authentichappiness.sas.upenn.edu/Default.aspx to get an idea of what he was on about.
2. The ‘Values technology and relational literacy’ presentation of Dr Janet Smith from the University of Canberra really distilled the conflict between students as digital natives and teachers as digital immigrants and the need to address this issue in schools. This is particular worth looking at in relation to the difficulties we are having around the world in getting teachers to embrace spatial technology. Students (digital natives) have no problems but the majority of teachers (digital immigrants) are the ones struggling with digital technology. Dr Smith gave some ideas and references which are worth looking at on the topic. Here are some of the references worth having a look at:
Marc Prensky on the digital diet (committed sardines)at http://www.marcprensky.com/
Ian Jukes in the age of technology at http://www.edtechnot.com/notjukes.html
Whole new mind by Dan Pink at http://www.danpink.com/
Maybe when teachers understanding the nature of the digital native student we may move forward with meaningful implementation of spatial technology in schools. In short we need to teach students as digital natives and see what their world looks like. We should not fight against their skills and globalised worldliness using technology but embrace it in the classroom.

3. George Williams (Law Professor, Uni of NSW) presented an excellent paper on the need for knowledge to enhance informed student views. In particular he outlined the reasons why civics and citizenship is not engaging for students (complexity, boring, community apathy and popular culture portrayal) and suggested ways to create a multi dimensional approach to move C&C forward in schools. In response to this talk I went away and developed a resource called 'Being a citizen' which has a section on using spatial technology in the teaching of civics and citizenship. Spatial technology and its ability to enhance knowledge of place should be a critical component of developing the informed citizen.

I am surprised by the limited amount of work done on the use of GIS in the teaching of politics and civics and see this as an area for some useful resource development for the classroom.
The ESRI site at http://www.esri.com/industries/federal/gis-business/gis-in-fedgov.html is particular useful as a reference on this topic. Watch this space for more thoughts and links on 'mapping politics' and citizenship education using spatial technology.

Friday, May 23, 2008

Using GIS in the Science classroom


Spatial Worlds website
Brisbane, Australia: S: 27º 29' E: 153º 08'
Left image: Science teachers at the GIS and Science workshop at Brisbane Boys College on May 23rd, 2008.
Right image: The Patawolonga outlet at Glenelg, Adelaide.

Putting the 'S' into Science!
This weekend I had the pleasure of conducting a workshop for Brisbane Science teachers at Brisbane Boys College on behalf of the Queensland Department of Natural Resources and Water. Mary Rowland, the President of Queensland Science Teacher's Association and Enterprise Education Education Officer was the workshop organiser and is keen to have GIS used in science classrooms in Queensland. The teachers at the workshop went through the GIS skill development process with a special focus on the application of GIS to Science topics. We heavily relied on the Arc Australia GeoScience data and the CityGreen program to explore topics such as earthquakes, geology, carbon seqestration, water quality, aquifers, microclimates, mineral resources, revegetation and much more. Mary in particular was interested in how GIS could be employed in schools for the Department of Natural Resources and Water's Waterwise Program.
As the workshop progressed it beacame evident that GIS is a wonderful tool to use in the Science classroom and is also the tool of the scientist in the 21st Century.
Here is some of the information from the days and some great websites to use when exploring the area of GIS in Science teaching.
1.Oresome Resources: Some excellent geological resources are to be found at http://www.oresomeresources.com/
2. The Department of Natural Resources and Water have developed a GIS application relating to ecosystem monitoring. Go to http://www.esriaustralia.com.au/esri/Training/Ecosystem_Monitoring_Task.pdf to view the resource.
3. Geoscience data: In the workshop the fantastic Geoscience Australia data of rock types, aquifers, mineral resources, earthquakes, bathymetry etc was profiled and used extensively. To find out about the data and how to get a copy go to :http://www.ga.gov.au/ and schools@esriaustralia.com.au for the information on the resource.
4. The IrfanView resource is a very useful free image edit program. The program can be used in particular to batch convert image files and crop exported images for GIS. Go to http://www.download.com/IrfanView/3000-2192_4-10021962.html?part=dl-IrfanView&subj=dl&tag=button&cdlPid=10755180 to download this free software.
4. A great resource for free data from the Internet is found at http://www.rsl.ox.ac.uk/guides/maps/mi_data.htm
5. The need for file format translation (such as MapInfo to Shapefiles as for the data above) is always an issue when accessing data from the Internet. The following links provide some options for the translation of one GIS format into the one required. They are: http://www.codeproject.com/KB/applications/MapinfoTab2Shp.aspx and
http://www.directionsmag.com/files/index.php/browse/1:4
6. The skills developed during the workshop related to the GIS skills development process I have developed to get teachers started using GIS in their classroom. Go to http://gtasa.asn.au/professional_development-free_pd_articles if you want to read about this process.
7. The American Forests CityGreen program was profiled as a way to go for Science teachers. Go to http://gtasa.asn.au/professional_development-free_pd_articles to read about this amazing program which promotes fieldwork and high level environmental analysis of vegetation and energy use when using GIS.
8. I feel that much work should and could be done to use GIS in Science teaching. Just like the case with the use of GIS by geographers in the workforce, GIS is increasingly being used by scientist as an aid to their work. To this end I have produced the GIS in Science resource which is being used in schools around Australia. Go to http://www.ausgeography.com/Techgeog/pdf%20files/articles/2Physical%20Geography%20article.pdf (called Physical GIS under the TECHGEOG label) to view an article on the resource. Several other useful GIS in Science orientated sites/resources are:
* Wisconsin Department of Natural Science at
http://natsci.edgewood.edu/wingra/watershed/watershed_gisresources.htm#Key%20GIS%20Resources
* Pathfinder Science site by Dr Tom Baker at http://kangis.org/learning/
* Australian Science orientated GIS projects for:
# Water quality mapping
http://www.xyz.au.com/public/general_info/details.cfm?info_id=1294&sub_cat=114&category_id=15
# Revegetation project
http://www.xyz.au.com/public/general_info/details.cfm?info_id=1302&sub_cat=114&category_id=15
# Pest plant diffusion
http://www.xyz.au.com/public/general_info/details.cfm?info_id=1290&sub_cat=114&category_id=15
9 .Go to ESRI lessons at http://gis.esri.com/industries/education/arclessons/arclessons.cfm to view science based GIS lessons.
10. The blog at http://gisinscience.blogspot.com/ is a useful resource for science teachers to explore the use of GIS technology in their classroom.

The days were a great opportunity to meet Science teachers in Queensland and to discuss the use of GIS in Science. Thanks to Mary Rowland and Peta Jackson from Education Queensland for organising the workshops and enabling me to travel to Brisbane for the activity.

Tuesday, May 6, 2008

AGTA 100 meeting in Melbourne


Spatial Worlds website
Melbourne, Australia: S: 37º 47' E: 144º 58'
Left image: The AGTA Board hard at work in Melbourne.
Right image: Nick Hutchinson, AGTA President cuts the AGTA 100th Birthday cake.

The Australian Geography Teachers Association (AGTA) conducted its 100th meeting of the Board in Melbourne on the weekend of May 3rd and 4th. The meeting involved GTA delegates from all the states and as always was a truly representative meeting of Geographers from around Australia.

For those not aware, AGTA is a body which seeks to:
• foster the teaching and learning of geography in Australian schools and enhance awareness of its applications in society
• promote and circulate the results of research into geography education
• maintain a professional network through which teachers of geography in Australia may express opinions on educational matters
• represent the interests of its member affiliates on national education decision making bodies.

In 2008 AGTA has a combined membership of 1721, which encompasses teachers and professionals who are members of affiliate Geography Teachers' Associations (GTA's) in New South Wales(476), Victoria(595), Queensland(228), Western Australia(250), South Australia(160) and Tasmania(12).
In this day of national curriculum discussions it is imperative that a body such as AGTA is in existence and most importantly healthy and active. As usual the meeting in Melbourne was full of information and pro-active plans to promote geography in Australia. Here are just some of the meetings discussions and actions:

1. An Australian Geography careers website has been developed by AGTA. Rob Berry, the web manager of the AGTA website has done a great job in putting together the Geocareers website at http://www.geocareers.net.au/index.htm. The site is a very ‘user friendly’ and useful site for learning about geographical careers. The Geocareers website contains resources links and case studies of young people who have done geography at school and see a link between what they learnt in geography and what they do in their job. A great site to pass on to the career counsellor/s and subject/career selection personnel in your school

2. AGTA Board members have represented Australian geography teachers on a range of national bodies since the last meeting of the Board (meets twice a year). AGTA is a member of the Australian Federation of Societies for the Studies of Society and Environment (AFSSSE at http://www.afssse.asn.au/ ), the Institute of Australian Geographers (IAG at http://www.iag.org.au/ ) the National Education Forum (NEF at http://www.nef.edu.au/home.html) and the Spatial Science Institute’s Spatial Education Advisory Committee (SEAC at http://www.spatialsciences.org.au/index.php?option=com_frontpage&Itemid=1)

3. In September 2008 AGTA is conducting its bi-annual conference in Queensland on the Sunshine Coast. The conference planning by the co-convenors, Rebecca Nicholas and David Lergessner is well underway and an exciting program has been developed for the week commencing September 29th. For information on the conference go to http://www.agta.asn.au/conf08/index.htm

4. A new publication titled ‘Keys to Fieldwork’ is presently being produced by AGTA. The book is being edited and written by members of the AGTA Board and is to be published by MacMillan. The book looks to be a great enabler of the fieldwork component in the teaching of geography in Australia and is due for release in October.

5. AGTA is working towards developing a strategic plan for the promotion of geography in Australian schools (and hopefully the community). AGTA is working with marketing professionals to develop a strategic plan to increase the profile and community awareness of what geography in the 21st Century involves. Hopefully such marketing of the ‘geography brand’ will aid the penetration of geography as a dynamic and critical subject area in the new national curriculum.

6. The National Geographic Channel Australian Geography Competition (http://www.rgsq.gil.com.au/agc.htm) was again conducted by the Queensland Royal Geography Association with the collaborative support of AGTA. The competition continues to grow and gain status in the Australian education scene. In 2008, 89,645 students from 819 schools participated in the competition. The winners for the 2008 competition will receive their awards in Sydney on June 16th.

7. Beijing Olympics materials: AGTA is presently producing resources in conjunction with the UK Geography Association to support the teaching of the geographical perspectives of the Beijing Olympics. These materials build on the successful AGTA Olympics kit which was developed for the Athens Olympics in 2004.

8. Each of the States reported on their happenings and initiatives. A lot seems to be going on in geography teaching in Australia. If interested go to http://www.agta.asn.au/htm_files/agta_news/AGTA_Geographia_Dec07.pdf to read the delegates reports in AGTA’s ‘Geographia’ publication.

9. AGTA’s annual journal titled ‘Geographic Education’ has recently be distributed nationally and internationally. The publication continues to receive good academic and school based feedback. A theme is presently being discussed for the 2008 publication. Go to http://www.agta.asn.au/htm_files/journal/index.htm if you are interested in subscribing – all AGTA affiliates receive a copy of the publication.

10. AGTA is involved as a partner in the Australian Research Council Linkages grant program to develop standards for geography teaching. The project involves video recording classroom teachers at work across Australia and for panels to view the videos and develop standards for teaching school geography. Volunteer teachers are presently being taped and panels established to carry out the process. AGTA considers such research will provide a rich resource and delineated standards for the advancement of geography teaching in schools in Australia. Contact Jeana Kriewaldt at http://www.findanexpert.unimelb.edu.au/researcher/person1729.html if you require more information on this project.

11. Significant discussions were conducted at the meeting in regards to the national curriculum and the place of geography. Most importantly there was discussion on what geography should look like when established as a subject in the national curriculum. Several delegates considered there is a need for members of the AGTA Board (and thus the states) to have considered discussions on what skills, knowledge and approaches should be advocated by AGTA as a united voice. Although the recent Erebus report (go to http://www.gtasa.asn.au/professional_development-information_to_forward to read the report) delineates many of these points, there is a need to distil what the report found in a considered manner to reach some form of consensus on AGTA as to the preferred geography model for schools.

As usual a very important meeting for geography teaching in Australian schools to ensure that the states are united in progressing the need for the teaching of geography in classrooms across Australia.