Tuesday, September 25, 2012

The Spatial Catch 22: de-skilled by technology,


Image above: Where are we heading with spatial literacy?

Related sites to the Spatialworlds project

Email contact
Where am I??
Sydney: S: 34º 0' E: 151º 0'


Drawing cross-section are dead!  Are they?

The Spatialworlds blog has spent a lot of time advocating the use of spatial technology in the classroom and in particular the need to embrace GIS as part of teaching and learning in the geography classroom. However this posting explores the possibility that there could be a downside of all-pervasive presence and omnipresent use of spatial technology in our society.  Such a proposition is highly relevant to the use of spatial technology in the classroom. The proposition is that the very technology which has popularised and democratised geography in the community may very well be deskilling the population geographically. No longer does one have to read a map or street directory; just use your GPS or Google Map to get there or find a place. Could this be deskilling the population to the extent that people will no longer understand or know how to read a map. Is this a problem? Many of us drive a car and have no idea how the engine works, play a CD and have no idea how the music is created etc etc.  However some would argue that in schools students should have an understanding of how ‘maps work’ and not just use them. They go on to argue that students, to really have spatial understanding, need to know, for example, how a cross section is constructed and how to read a grid reference and that these are necessary spatial literacy skills for a student. So what some say is busy geography lessons; drawing maps by hand, constructing cross sections and plotting reference points may still have a place in a geography class despite the plethora of just a ‘click away’ spatial technology so readily available for the classroom these days.

A recent blog posting by a GPS marketing firm affirmed what I had been thinking on the matter.  The posting asked us "not to eliminate older technologies in our haste to embrace the shiny and new". The posting is naturally pro-technology but suggests that we must keep "an assortment of paper maps readily available" in case the "tracking systems down, natural or terrorist events occur, Sun Spot activities interfere with the satellites, nuclear explosion, civil unrest or roadworks requiring a detour (GPS does not know about that)" - yes, we get the idea; technology is not fool proof but any fool should be able to read a map to get to safety.

"Technology is great but it should never be a replacement for skills but a tool used to assist you."

The danger is that it has become too simple to listen to your GPS or read your IPhone Maps to get to a place and there is no need to use paper maps. We are becoming a society lacking basic mapping skills and the associated  spatial literacy capacities. The very technology built on amazing spatial understanding could be creating a spatially illiterate society with citizens being prepared to be a slave to the voice on their GPS or blue dot on their IPhone and not think for themselves using maps. .

Schools should use spatial technology so that students are aware of the power, functionality and applications of the technology. With caution I am also arguing that students should have the  capacity to use maps in a practical sense to have an understanding of the underlying basics of maps so that they can use the technology judiciously and even be able to survive without the technology if  the need arises.  Both are basic spatial citizenship skills.  We must be careful "not to throw the baby out with the bath water!"

Postscript: Ironically a week after this posting, Apple released IPhone 5 with the subsequent controversy related to the new Apple Maps.  Apple had replaced Google Maps on the IPhone with their new Apple Maps.  That is an interesting industrial story in itself but what was really interesting is that these new maps were found to have significant problems with accuracy and representation. Apple quickly withdrew the new maps with the damage not only done to the IPhone but also to public trust in the accuracy of spatial technology. Maybe this was a good thing! Maybe the public will realise that they should always have some spatial literacy skills and understanding of geography as they use these wonderful technology tools.

Friday, September 21, 2012

Look and learn!


Image above: 'Into the mist' at Melbourne Airport at 6am. Not the slogan for Qantas, I hope!


Related sites to the Spatialworlds project


Email contact


Where am I? 
Melbourne, Australia: S: 37º 47' E: 144º 58'


Some resources and visualisations for the Geography classroom

This is a fantastic GeogWiki for the classroom, with videos and animations to help teach/learn about population and population structure
Water, geomorphology  climate, weather and much more.  A useful site which will just grow and grow.


A great site with many useful videos for geography (yes you need to register but so free and worthwhile!)
To view the Geospatial videos put in this URL when you have registered on the site.  Some excellent Geospatial and why do Geography and GIS videos.


An interesting insioght into how they make GoogleMaps.


This newly released interactive feature allows students of all ages to see the global interconnections in their lives.   By analyzing the items in our closets (or any of the items that we consume), we can easily see that  our own personal geographies create a web of global interconnectedness.

* The 100 People Project: An Introduction

If the world were 100 people, who would we be? The 100 People Project attempts to paint a portrait of the world population through video, photography, and other educational media. We're asking the children of the world to introduce us to the people of the world. Help us make the world portrait!

An example of a student at Rhode Island College learning some mappings skills and applying them to the local news.
 A great example of the power of maps (GIS) to unravel election trends in the past and now. Very relevant as election news hots up in the US and Australia.

* The New World 2012

Interactive maps of the New World from the New York Times. 

* The State of Women in the World

An Inforgraphic highlighting the state of women in the world.

 * World population distribution and location

These attractive infographics depict the distribution of the 2008 world's population based on longitude and latitude. Beautiful depictions of population density around the world.


Cloud Globe is an interactive Chrome Experiment visualizing over 2 years of Earth's cloud cover on a 3D globe. You will need to have Google Chrome installed


Who is protesting where? A great real-time political geography site.


Saturday, September 15, 2012

Thinking Geographically: a new resource


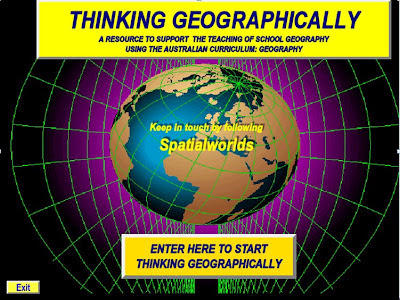
Image from the Thinking Geographically interactive DVD.

Related sites to the Spatialworlds project
Email contact

Where am I??
Adelaide, Australia: S: 34º 55' E: 138º 36'


The Thinking Geographically resource


A resource has recently been produced to support professional learning in geography. The resource is called 'Thinking Geographically' because that is what we need to start working on with teachers in Australia who soon will have the opportunity to teach the Australian Curriculum: Geography.

The 'Thinking Geographically' resource is in the form of an interactive DVD and is aimed at preparing geographers and non-geographers in Australian schools to deliver the new Australian Curriculum: Geography from 2013 and beyond. Despite the Australian focus, the resource would be of equal value to any country teaching geography as a subject in schools.

As I have discussed in previous postings, there is a need to articulate clearly to non-geographers in particular what geographer actually is. That is, to be able to explain what makes geography geography. One of the invaluable lessons I have learnt from being involved in the development of the ACARA Australian Curriculum: Geography is the opportunity to clarify my thoughts on what geographical thinking is. The development of the key concepts of the Australian Curriculum: Geography has been invaluable in 'nailing down' geographical thinking. Everything can be studied geographically through the key concepts - hence every topic is a potential resource for geography classrooms.

The resource comprises a range of Geographical 'think pieces', articles and presentations, tips and structures for curriculum planning and hundreds of Internet sites to support geographical education in schools. The attached document provides a useful insight into the operation and nature of the resource.

I hope the resource will be a useful part of the implementation and associated professional learning for the Australian Curriculum: Geography and any other country teaching geography in schools.

If you wish to have a copy of the interactive 'Thinking Geographically' DVD just download the order form or email me at manning@chariot.net.au and I will forward the DVD to you. Hopefully it will hit the mark with professional learning on thinking geographically.

Sunday, September 2, 2012

Sharing nicely!


Image above: Facebook traffic. Showing the interconnection of our world and potential to share.

Related sites to the Spatialworlds project
Spatialworlds website
Australian Geography Teachers' Association website
'Towards a National Geography Curriculum' project website
Geography Teachers' Association of South Australia website
Humsteach blog

Follow Spatialworlds on Twitter

Email contact
manning@chariot.net.au

Where am I??
Adelaide, Australia: S: 34º 55' E: 138º 36'


The Internet has an amazing capacity to support teachers sharing ideas and resources. There is so much activity happening 24/7 on the Internet - this fact was really brought home to me last weekend at the GTAV conference when the site called “60 seconds on the Internet” was showcased. It is heartening that a tiny part of all this activity is helping geography teachers to share and improve their knowledge and access to resources. I would like to think that blogs such as Spatialworlds, with Twitter, Google Groups and Google docs presentations are all going towards an interconnected and collegiate environment of sharing for geography teachers on a global scale.

The following sites from the UK certainly show that sharing is alive and well amongst UK geography teachers:


Whilst on free resources on the Internet to help support the teaching of 21st Century Geography, have a look at the Google Earth Official YouTube Channel to learn and share.  Google Earth lets you fly anywhere on Earth to view satellite imagery, maps, terrain, 3D buildings, from galaxies in outer space to the canyons of the ocean. You can explore rich geographical content, save your toured places, and share with others. While talking about Google Earth, go to Google Earth lessons for some amazing ideas.

These are just a few examples of sharing of resources on the Internet.  I am sure it will only increase as Twitter and other Internet sharing programs gain currency and popularity amongst geography teachers (even those currently computer illiterate).

Saturday, September 1, 2012

Being critical


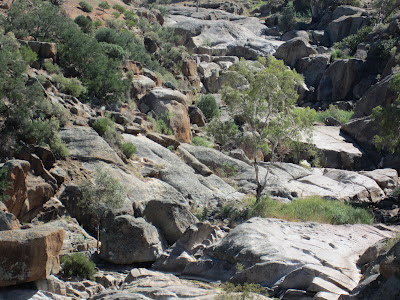
 Image above: Mannum Waterfall in South Australia (rarely with water these days but once upon a time it would have been a raging torrent). This geomorphology paradise is 70 kms outside of Adelaide on the way to Mannum on the River Murray. The rocks are at the edge of the Southern Australian Batholith with Migmatites prevalent. The waterfall has been a favourite fieldtrip location for geography and geology students in South Australia for many years.

Related sites to the Spatialworlds project
Spatialworlds website
Australian Geography Teachers' Association website
'Towards a National Geography Curriculum' project website
Geography Teachers' Association of South Australia website
Humsteach blog

Follow Spatialworlds on Twitter

Email contact
manning@chariot.net.au

Where am I??
Adelaide, Australia: S: 34º 55' E: 138º 36'


 Critical literacy and websites

As a repository of websites and other resources to be used for geography teaching, this website frequently points teachers in the direction of websites. Most of these websites are not established for the classroom and may not have the quality assurances (QA) that educational sites would have. Naturally, websites from creditable organisations such as National Geographic and Government bodies would have undergone significant quality assurance (but still may be biased towards the governments or organisations goals/agenda). Recently I sent out a website called "History of conflicts". Thankfully we all don't just take for granted what the website represents. In this case I was alerted by a colleague that there was some inaccurate information on the site. Hence this posting on critical literacy. Whenever we get a website to use we should put it through the QA test and ask some tough questions in respect to origin, agenda, data accuracy and representational appropriateness.

Being critical may be defined as a challenging approach to the reliability, usefulness and bias of a source. It involves the questioning and challenging of the data, representations, attitudes, values and beliefs that lie beneath the surface of a source, in this case, geographically orientated websites.

To be critical is often associated with being negative or finding fault unreasonably but being critical should focus on:

  • careful or analytical evaluations
  • skillful judgement as to the truth or merit of something.
An ability of a person to be critical is sometimes referred to as a type of literacy (literacy meaning an 'ability to').

In the case of critiquing a website the following questions should be asked:
  • Who has gathered and curated the information on the website?
  • How much of it is fact and how much opinion?
  • Is the information biased? 
  • Is the data accurate?
  • Is the representation (map/graph) been used to distort the data?
  • Whose point of view and/or data is missing? 
  • Have appropriate representations been used? 
  • Is this an ‘expert’ opinion?
  • How objective is the information?
  • How do the opinions reflected in this information compare to that of other groups?
  • What are the values and attitudes implicit in this information?
To ask these questions is to be critical in a positive evaluative way. 
 
Credibility being something that is credible and is worthy of being believed because it has a high degree of accuracy. Some sources of information are more creditable than others. Newspapers and magazines vary greatly in their credibility as do television programs and the Internet. No source can be totally creditable; each has a degree of credibility which must be acknowledged and discussed to explain how it effects the conclusions.

Bias
being the misrepresentation of information to create a distorted view that could create opinions that are not credible. Much of the information we receive is biased in some way. It may not be so much what data is a website but rather what is missing. Taking a particular point of view and disregarding all other perspectives is a form of bias as is leaving parts of information out. It is always important to identify whose point of view or data is not represented, and why it is not presented in any information that you have.

Some sites to critique

Have a practice on some of these sites.  Are they creditable, objective and accurate. How would one know? At least we have to ask the questions!
  
TerraMar is comprised of a globally representative group of experts, NGOs and citizens whose mission is to protect the ocean for generations to come. We are members of the High Seas Alliance & The Deep Sea Conservation Coalition.

Polling data in which people were asked what factor shaped their acceptance of climate change.  new paper that dives into extensive polling data to find out how people perceive different trends in the climate.

An interactive site listing all the countries with supporting data


All the world's earthquakes since 1898 on one map.