Showing posts with label spatial technology. Show all posts

Thursday, December 3, 2015

OOh's for Queensland Mick


Image above: NSW Globe, just one of the great sites used by Mick Law in his AGTA Roadshow presentation.

Related links to Spatialworlds
GeogSplace (a teaching blog for Year 12 geography)
Geogaction (geography professional learning blog)
Spatialworlds website
GeogSpace

Australian Geography Teachers' Association website
manning@chariot.net.au


Ooh's and Wow's at AGTA Roadshows

Last week I had the pleasure to participate in the AGTA Roadshows in Canberra, Newcastle and Sydney. The roadshow programme was not only a great way to make contact with hundreds of teachers in NSW and ACT to talk geography but also to work with some real stars in geographical education. Grant Kleeman, John Butler, Susan Caldis and Mick Law took part in the roadshow with me and certainly enthused those who attended. I must say, the one who got the most ooh's and wow's is Mick Law from Contour Education when he shared his amazing knowledge and experience in using spatial technology in the classroom. The next few Spatialworlds blog postings will share a few of the resources Mick presented.

QSET

This posting  showcases Mick's new Queensland Spatial Educators’ Toolkit (QSET), a one-stop shop of achievable, engaging and curriculum related sites for teachers to use. The toolkit is an excellent spatial technology resource for the Australian Curriculum: Geography


The Queensland Spatial Educators’ Toolkit (QSET) is now available to download as an interactive pdf for Primary (P-6) and Lower secondary (7-10) educators. The toolkit provides educators with over 130 ideas for incorporating free spatial technologies into their classroom teaching and learning. QSET is designed to make it as easy as possible for teachers to incorporate spatial technologies into their classroom teaching and learning.

The resource does refer to some Queensland-specific tools but most of the over 130 freely available 'learning experiences' (Queensland education jargon) tools that can be used at all year levels by any teacher in the country. Each year level of the Australian Curriculum: Geography is addressed from F-10.


For further information regarding QSET please contact Mick Law from the Queensland Spatial Information Council on  07 3406 2807 or via email spatialeducation@qld.gov.au

This is really a great resource for teachers, and although a little Queensland focussed in parts, it really is the best thing produced in Australia for ages as an entry level and curriculum connected resource for teachers to use spatial technology in the classroom. Congratulations to Mick, he is indeed the man in Oz for spatial technology in the classroom. Keep the ooh's and wow's going Mick - in 2015 it is not easy to get those reactions when presenting as technology (including spatial technology) has become such a common part of our everyday life. Back in 2005, or even 2010 you could get an ooh's for some pretty basic spatial technology but not now!!

It is certainly worth visiting Mick's other Contour Education blog resources at:
http://preservicespatialtech.blogspot.com.au/
http://www.contoureducation.com/links
http://www.contoureducation.com/resources

Mick is available to work in schools and with partnerships/clusters of schools  and certainly does some great work supporting teachers to master the spatial technology learning curve.

Thursday, July 16, 2015

Locating in South Australia


 As the publicity blurb goes:

"Have you ever wanted to know where your nearest shipwreck is, or every earthquake location in SA since 1836? Maybe you want to check the high school zone of a house you want to buy … or want to know where the closest walking and bike trails are?  Or you know someone who wants to start a business on a road that has high traffic volume? You can check all of these things and more from the Location SA Map Viewer."


This brand new website (launched on June 28th, 2015) is a great resource for teachers in South Australia wanting to use spatial technology, combined with interesting local data -  however for spatial analysis purposes the site is highly relevant to teachers outside of South Australia as well. The wide range of Government spatial data has been combined on a single website, allowing easy access to everything from public transport to planning development zones and Marine Parks in one view. Location SA has data on landscape and water resources, environment and climate, land management, infrastructure and utilities, business and industry, society and events, and emergency and safety. The viewer can also be viewed as a road map, topographic map or satellite image.


The Location SA Map Viewer is part of the South Australian Government’s plans to proactively release data and make South Australia the best place to do business. Approximately 160 government data sets are currently available to view on the Map Viewer and more will be added soon.

This site is just another example of how spatial technology and associated data is becoming accessible to the classroom by being free, user friendly and visually uncluttered and attractive.

Wednesday, March 4, 2015

Tourist hotspots


 Image above: An interesting take on the impact of technological change on lifestyle by John Atkinson of Wrong Hands  - great cartoons.


Related links to Spatialworlds
GeogSplace (a teaching blog for Year 12 geography)
Geogaction
Spatialworlds website
GeogSpace

Australian Geography Teachers' Association website
manning@chariot.net.au

Where am I??

Adelaide, Australia: S: 34º 55' E: 138º 36'


Tourists v locals: city heat maps show where sightseers flock


Here is an interesting spatial technology application to show tourism patterns and inform tourism development in some of the large sities of the world. Eric Fischer’s fully browsable worldwide map shows blue points for ‘locals’ – tweets by people who have tweeted in the city over a month or more – and red points for ‘tourists’, those who tweeted there less than a month


Blue points on the map are Tweets posted by “Locals”: people who have tweeted in a city dated over a range of a month or more.

Red points are Tweets posted by “Tourists”: people who seem to be Locals in a different city and who tweeted in this city for less than a month.

Friday, January 30, 2015

Comparison across the cities of the world


Image above: The fantastic for comparison Urban Observatory site.

Related links to Spatialworlds
GeogSplace (a teaching blog for Year 12 geography)
Geogaction
Spatialworlds website
GeogSpace

Australian Geography Teachers' Association website
manning@chariot.net.au

Where am I??

Adelaide, Australia: S: 34º 55' E: 138º 36'


The comparison skill

"Anyone could enjoy playing with the data—and that’s the point. "This isn’t an esoteric thing for city planners. It’s meant for the population to understand themselves." says Wurman.

The Urban Observatory gives students the chance to compare and contrast maps of cities around the world–all from one location. It aims to make the world’s data both understandable and useful. The Urban Observatory at http://www.urbanobservatory.org/preview/uo//preview/uo/ (paste this link into your browser) has been brought to life by TED creator Richard Saul Wurman, RadicalMedia, and Esri, and is the first of its kind.

The creators of the interactive site say that:

"We live in a world of easily accessible maps; just tap your smartphone and you have instant access to directions, public transportation information, locations of landmarks, crime data, and neighborhood facts. But our map knowledge is limited by the fact that no two cities collect data the same way. Maps often aren’t drawn to the same scale, and up until now, there hasn’t been a way to compare data on things like income, cost of living, water distribution, and power grids."

Here are some instructions for the site - a really interesting and useful addition to the plethora of great free spatial sites available for the classroom. Click here to go directly to the comparison section of the site


The Urban Observatory city comparison app enables you to explore the living fabric of great cities by browsing a variety of cities and themes.

To change Themes, click on a theme name in the Themes list.
To change Cities, click on the city name in the Cities list, or drag-and-drop it over a map.


The TED creator has big plans for the Observatory in the future. 
"It should be 100 cities, connected to a source that updates it like an app," he says. "Cities could learn from the mistakes and failures of others."


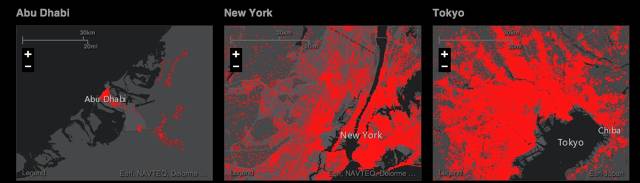
For now, check out the Urban Observatory website, which features most of the exhibit’s city comparison functionality. Here’s a look at the youth population of Abu Dhabi, New York, and Tokyo, emphasizing areas where youth make up over 33% of the total population.


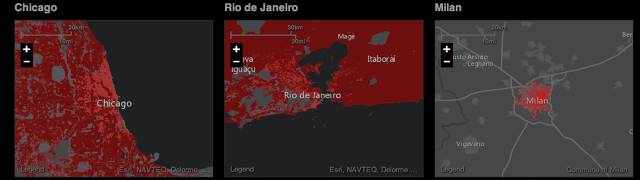
And here’s a housing density comparison between Chicago, Rio de Janeiro, and Milan.


Tuesday, December 2, 2014

The importance of cricket to place


Image above: Just a bat and cap, but meaning much more to those in a place.

 As a cricketer, you're part of a wider family. The cricket family. You automatically have a connection with others without even meeting. The passing of Phil Hughes has proven that, we are all shocked by it and genuinely feel for his family and friends. He was what we all hope to be, a genuine person and dedicated to what he wanted. This was never the way it was supposed to end, too soon. Sean Abbott, the entire cricketing world is also behind you. You are an innocent who never meant for this to happen. You have no reason to feel guilty. Rest in Peace Phillip, you were a once in a generation player, who touched the world.  
Manning McInerney


More than a game for many Australians

The geography of sport has been a recurring theme on this blog over recent years. Sport is an important cultural phenomenon and has geographical relevance in terms of the concepts of place, space, interconnection and change. Sport can be studied in cultural geography in relation to sense of identity and place and many aspects of sport can be mapped to show diversity across space. With the tragic events of the past week and the funeral of Phil Hughes today I thought the time was right to do some geography on cricket. 

The dedication above to Phil Hughes was written by my 22 year old son on Facebook last week.  I could not have said it any better and it shows the raw emotion the event exposed in many of us - people we never see cry were overwhelmed by emotion. Raw emotion which many of us find hard to explain. The rational side of us says that all those dieing in accidents is sad and deserve a similar emotional response but this one really hit home. Such a reaction is a complex amalgam of cultural importance of cricket, identity and meaning attached to place, hero worship, the tragedy and irony of the timing, the Australian love of the battler, his bush and fun loving quality and the waste of talent and potential for the future - they all combined to create an event many of us will always remember. Interestingly Michael Clarke in his eulogy at the funeral talked about spirit and attachment to a place such as the Sydney Cricket Ground (SCG) - a very real and heartfelt expression of the importance of place at this stage of his and others grieving.

This posting tries to unravel the geography of cricket. For example, to non-cricketing countries, the magnitude of Australians' and Indians' love for cricket is as incomprehensible as its feverish intensity. 

 A typical scene in cities and villages all over India, this one in Agra.

On February 4th India awarded the Bharat Ratna, its highest civilian honour, to Sachin Tendulkar, a recently retired batsman. Millions in India, a country of 1.3 billion people and only one nationally-popular game, celebrated wildly. When India's national side plays a big game, an estimated 400m watch on television. Yet cricket's take-off in India is a highly improbable development. The game is demanding to play properly, requiring space, a good turf pitch and expensive equipment—which only a relative handful of Indian cricketers have access to. Most will never strap on pads or bowl with a leather ball. The attached article asking "Why Indian's love cricket so much" is an interesting discussion for cultural geography. 


 A map showing the most popular sports around the world. India, Pakistan and Australia are the major countries where cricket dominates.

As the map above shows, the overwhelming majority of countries see cricket as a minor or even non-existent sport. The historical geography answer to its distribution is very much tied into cricket being a legacy of the British Empire. However even that explanation is not comprehensive when we realise that cricket never took off in Canada or Hong Kong for example. The environmental determinists will argue that these countries did not embrace cricket because of their climate or scarcity of land for open fields. If that is the case, then why not the United States of America? The USA has a  perfect climate for cricket and plenty of land - was it just a hatred of the English after the American Revolution and a general mismatch of the game to the America culture that stopped them embracing cricket when all the other Anglo culture/British Empire nations were doing so in the 19th Century.  


The map above shows the distribution of cricket playing countries according to International Cricket Council (ICC) membership and the map below shows the most popular spectator sports. Maps that indicate the distribution and popularity of cricket on the world sporting scene. 


Regardless of crickets paucity of spectators across the world, it is undeniable that cricket has a very special place in the hearts of those living in many places. The depth of emotions surrounding the death of Phil Hughes over the past week has made me realise how irrationally important the game of cricket is to the Australian culture. Cricket is a game played in every state of Australia and plays an important role in the development of young people, the recreation and identity of young adults and the meaning of life for many of us. Yes, cricket means nothing for many Australians, especially migrants from non-cricketing countries, but it is part of the cultural fabric of the place called Australia (as is the case for India and Pakistan). The importance of Don Bradman during the tough times of the 1930's Depression in Australia also highlights the importance of cricket to Australians over the past century. Interestingly, only in India and Pakistan is cricket the most popular spectator sport, with Aussie Rules dominating that aspect of Australian life. However many Australians feel engaged with and passionate about cricket by reading game reports, viewing statistics, watching TV or listening to the radio - but they never see it played live!

Cricket by nature is a very spatial game with a plethora of established and named positions on the field. 


The map above of a cricket field showing fielding positions, features and terminology is often seen as a confusing map for those not initiated into cricket. The captain of a cricket team is certainly an expert on spatial matters, manipulating angles, reading patterns (of shots) and changing locations (fielding positions) in response. In response to the spatial fascination of cricket fans, spatial technology has certainly been put to good use through programs such as Hawkeye (showing the trajectory of a ball or shot), Wagonwheel (the distribution and path of shots) and Pitch Map (where the balls land on the pitch). The images below are applications of spatial technology which we have come to expect as we watch cricket on television. In fact, the technology originally just to augment the TV coverage is now being used by cricket authorities to adjudicate on-field decisions. You cannot but think spatially when looking at these visualisations in cricket.

Pitch Map
Hawkeye
Wagonwheel

For this blog posting I searched for resources on the geography of cricket. Other than the maps and reference to technology discussed above, there was little on this fascinating cultural geography study. When one considers the importance of a game such as cricket to place, I am somewhat surprised that there has not been a lot more geographical thinking on the topic. Maybe there is and I have not found it as yet! I will continue to look but if anyone has more to add on the topic, please feel free to make a comment.

Finally on this sad day for many of us, RIP Phil Hughes, you have been a marvelous role model to many young (including my son) and older Australians and your name, talent and demeanor will not only live on amongst cricket fans but also become a part of the ever developing cultural identity of this place called Australia.


Friday, May 16, 2014

Data junkies


Image above Tempting fate with extreme adventures in amazing landscapes.

Related links to Spatialworlds 
Geogaction
Spatialworlds website
GeogSpace

Australian Geography Teachers' Association website
manning@chariot.net.au    

Where am I??  
Adelaide, Australia: S: 34º 55' E: 138º 36'

 
Accessing some interesting data

After learning how to use GIS, the next challenge is to find user friendly data to import. For the data junky this is the food for GIS!  However, as with anything desired, it is not always smooth sailing. There is an enormous amount of free data on the Internet but teachers often find that the data is:
  • in a different projection to the base maps they have been using
  • not in the file format they require i.e. MapInfo .tab format instead of the ESRI .shp format
  • difficult to download
  • not the local data they require
  • the same old data that is easy to access ie.generic world data
  • old data
  • US focussed (the greatest producer of spatial data)
  • poor quality data with data missing (has been deleted because of cost or confidentiality).
Needless to say, the access to data can be problematic for the novice (and experienced). 
Despite these concerns, the access to free data is easier than ever. Just check out the following sites to view the free data available in Shapefile format. The shapefile (or ESRI shapefile) format is a geospatial vector format and one of the most common (if not the most common) map format around the world.

* Free Shapefiles from Stat Silk 
On this site there are thousands of shapefile maps from a range of websites, including country shapefiles, shapefiles at province or state level, and other administrative boundaries maps. The shapefile (or ESRI shapefile) format is a geospatial vector format and one of the most common (if not the most common) map format.

* MapCruzin free Shapefiles 

* A listing of sites offering free Shapefile data
  
* Free GIS data in geography topic areas

* Free South Australian spatial data: In September 2013, the SA Premier announced a Declaration of Open Data to make government data available for use by business and the community. As a result, free spatial data in South Australia is coming on-line on a daily basis. This DATA SA site has some great data sets as Shapefiles and Google Earth KML files.  Just go to http://www.data.sa.gov.au and search for 'spatial' using the 'Search Box' to view the spatial data sets. If you are after the ever elusive crime data, just enter 'crime' in the search box (the crime data needs to be joined to another data set which is a bit of a pain but achievable with a bit of work). 


With such great data available and free GIS software, such a QGIS now available, nothing should be able to stop us using GIS in the classroom - or just by ourselves for geographical fun.