
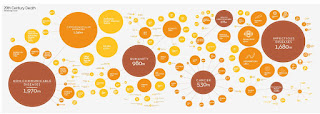
Image above: An infographic showing country number one's, the work of David McCandless who says he wants to 'distill the world’s data, information and knowledge into beautiful, interesting and, above all, useful visualisations, infographics and diagrams'. A fine cause for us geographers.
Related links to Spatialworlds
GeogSplace (a teaching blog for Year 12 geography)
Geogaction (geography professional learning blog)
Spatialworlds website
GeogSpace
Australian Geography Teachers' Association website
Making data live!
A previous Spatialworlds posting highlighted the importance and potential of visualisations to student learning - the importance of visualisations to provide proportional spatial information on a topic to help expose the truth, develop perspective and inform. That posting also proposed the idea that data tables in books are where data goes to die and that the potential of visualisations in the form of infographics is a powerful learning and engagement tool for students. With these thoughts still going around in my head, I was excited to find a great website called Information is beautiful.
The site is full of some great infographics, discussions, inter-actives and ideas about how to creatively represent data. The site and the available book, also called Information is beautiful contains some amazing infographics which certainly blow apart some commonly held myths, provide copious information and some great 'out of left field' perspectives on a wide range of topics/issues - all that could be made relevant to the geography classroom.
The work is the brainchild of David McCandless, a London-based author, writer and designer. David has a passion for visualizing information – facts, data, ideas, subjects, issues, statistics, questions – all with the minimum of words. In particular he is interested in how designed information can help us understand the world, cut though mis-truths (BS he calls it) and reveal hidden connections, patterns and backstories - all very geographical! Interestingly he says his pet-hate is the representation of data as pie charts - hence expect to see data represented in all shapes and sizes - but not pie charts.
To give a taste of what David's work offers the geography/history/social science/humanities teacher, I have picked out just a few that I found fascinating. Have a play with the following infographics, the first two are interactive and certainly makes one think and challenges some assumptions and thought truths! - others just provide some really useful and easily digestible information.


Have a look at the infographics on the site, you will be hooked and certainly inspired to doing something with them. Think about visiting David's blog and Twitter feed - and even buy his books!
Why not get your students doing infographics?
If you are inspired by David's work, consider using some free infographic maker websites. There are plenty on the Internet and they can be a really useful classroom tool for student learning.
If you are inspired by David's work, consider using some free infographic maker websites. There are plenty on the Internet and they can be a really useful classroom tool for student learning.
No comments:
Post a Comment