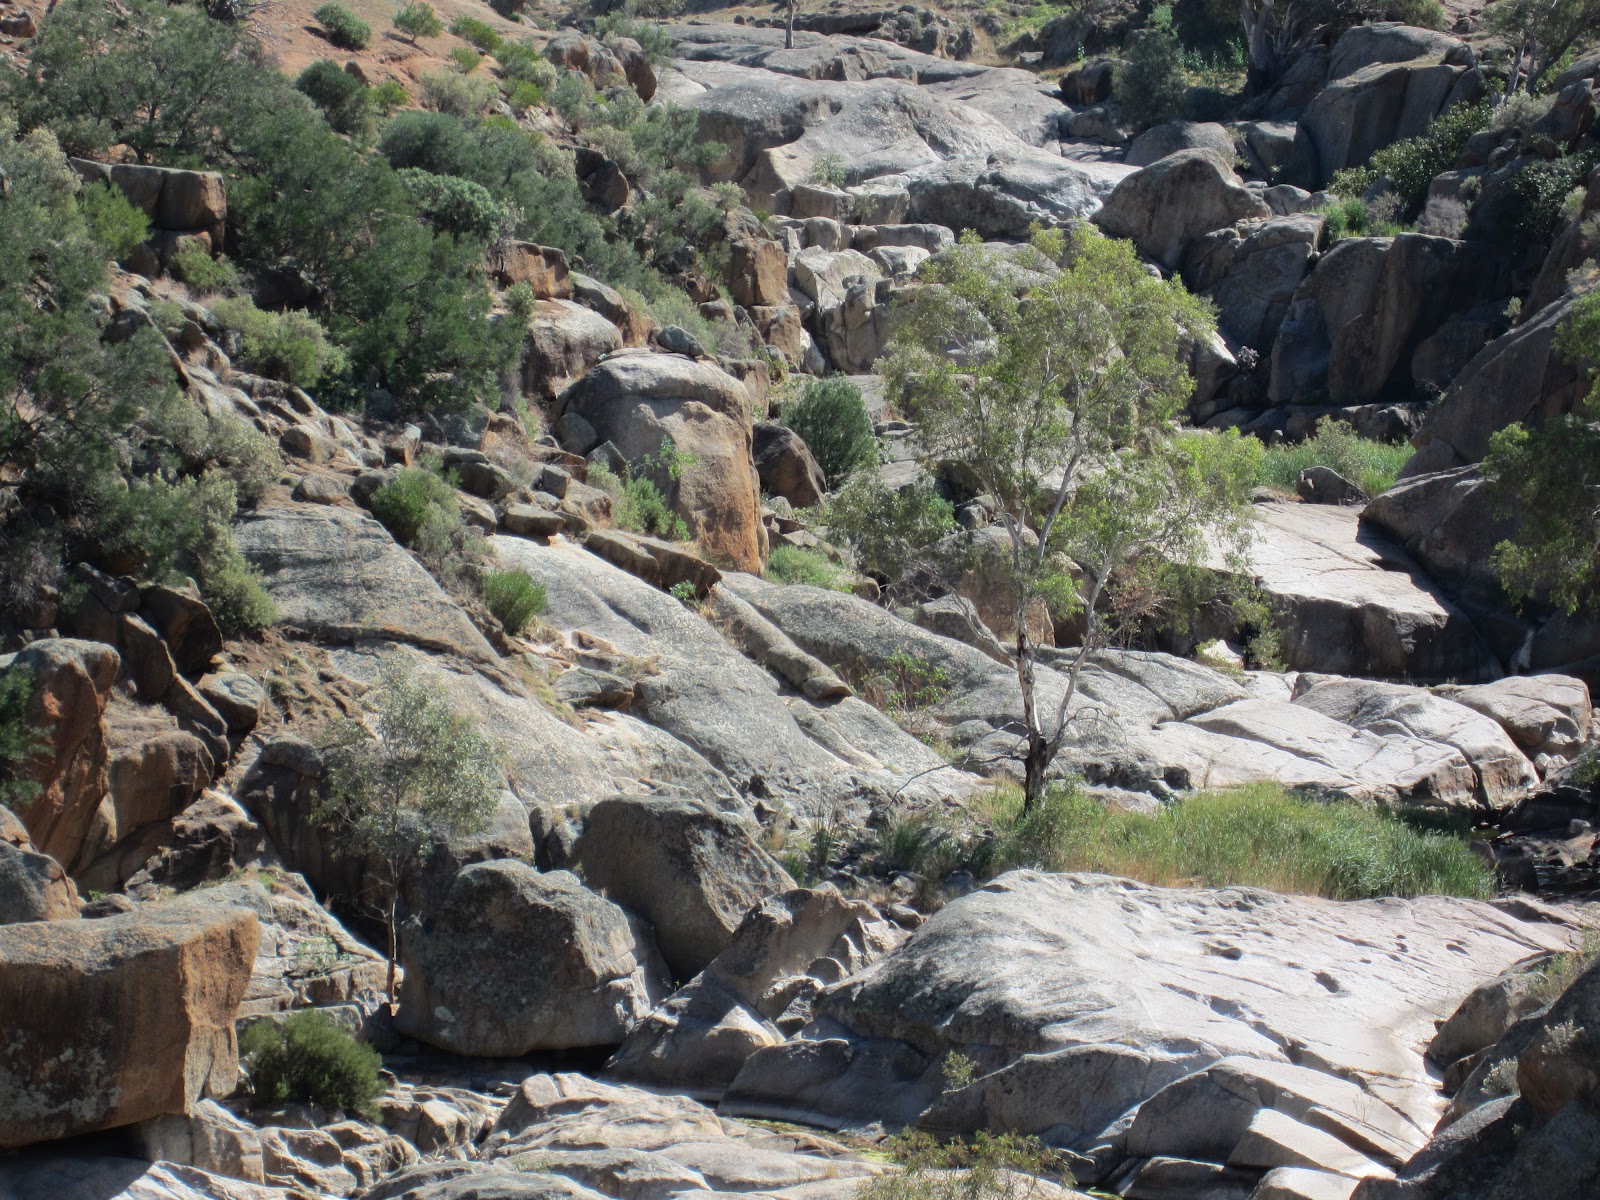
Image above: Mannum Waterfall in South Australia (rarely with water these days but once upon a time it would have been a raging torrent). This geomorphology paradise is 70 kms outside of Adelaide on the way to Mannum on the River Murray. The rocks are at the edge of the Southern Australian Batholith with Migmatites prevalent. The waterfall has been a favourite fieldtrip location for geography and geology students in South Australia for many years.
Related sites to the Spatialworlds project
Spatialworlds website
Australian Geography Teachers' Association website
'Towards a National Geography Curriculum' project website
Geography Teachers' Association of South Australia website
Humsteach blog
Follow Spatialworlds on Twitter
Email contact
manning@chariot.net.au
Where am I??
Adelaide, Australia: S: 34º 55' E: 138º 36'
Critical literacy and websites
As a repository of websites and other resources to be used for geography teaching, this website frequently points teachers in the direction of websites. Most of these websites are not established for the classroom and may not have the quality assurances (QA) that educational sites would have. Naturally, websites from creditable organisations such as National Geographic and Government bodies would have undergone significant quality assurance (but still may be biased towards the governments or organisations goals/agenda). Recently I sent out a website called "History of conflicts". Thankfully we all don't just take for granted what the website represents. In this case I was alerted by a colleague that there was some inaccurate information on the site. Hence this posting on critical literacy. Whenever we get a website to use we should put it through the QA test and ask some tough questions in respect to origin, agenda, data accuracy and representational appropriateness.
Being critical may be defined as a challenging approach to the reliability, usefulness and bias of a source. It involves the questioning and challenging of the data, representations, attitudes, values and beliefs that lie beneath the surface of a source, in this case, geographically orientated websites.
To be critical is often associated with being negative or finding fault unreasonably but being critical should focus on:
- careful or analytical evaluations
- skillful judgement as to the truth or merit of something.
An ability of a person to be
critical is sometimes referred to as a type of literacy (literacy meaning an
'ability to').
In the case of critiquing a website the following questions should be asked:
In the case of critiquing a website the following questions should be asked:
- Who has gathered and curated the information on the website?
- How much of it is fact and how much opinion?
- Is the information biased?
- Is the data accurate?
- Is the representation (map/graph) been used to distort the data?
- Whose point of view and/or data is missing?
- Have appropriate representations been used?
- Is this an ‘expert’ opinion?
- How objective is the information?
- How do the opinions reflected in this information compare to that of other groups?
- What are the values and attitudes implicit in this information?
Credibility being something that is credible
and is worthy of being believed because it has a high degree of accuracy. Some
sources of information are more creditable than others. Newspapers and
magazines vary greatly in their credibility as do television programs and the
Internet. No source can be totally creditable; each has a degree of credibility
which must be acknowledged and discussed to explain how it effects the
conclusions.
Bias being the misrepresentation of information to create a distorted view that could create opinions that are not credible. Much of the information we receive is biased in some way. It may not be so much what data is a website but rather what is missing. Taking a particular point of view and disregarding all other perspectives is a form of bias as is leaving parts of information out. It is always important to identify whose point of view or data is not represented, and why it is not presented in any information that you have.
Some sites to critique
TerraMar
is comprised of a globally representative group of experts, NGOs and citizens
whose mission is to protect the ocean for generations to come. We are members
of the High Seas Alliance & The Deep Sea Conservation Coalition.
Bias being the misrepresentation of information to create a distorted view that could create opinions that are not credible. Much of the information we receive is biased in some way. It may not be so much what data is a website but rather what is missing. Taking a particular point of view and disregarding all other perspectives is a form of bias as is leaving parts of information out. It is always important to identify whose point of view or data is not represented, and why it is not presented in any information that you have.
Some sites to critique
Have a practice on some of these sites. Are they creditable, objective and accurate. How would one know? At least we have to ask the questions!
Polling data in which
people were asked what factor shaped their acceptance of climate change. new paper that dives into extensive polling data to find out
how people perceive different trends in the climate.
An interactive site listing all the
countries with supporting data
All
the world's earthquakes since 1898 on one map.


